Chapter 5 Air Quality
5.1 Indicator definition
Poor air quality in the UK results in ca. 40,000 (+/-25%) deaths every year (Royal College of Paediatrics and Child Health 2016). Owing to this, air quality in England is regulated by legislation as part of the Environment Act of 1995 (UK Government 1995), which requires the production of a national Air Quality Strategy that sets out targets and objectives for the improvement of ambient air quality. The Air Quality Standards Regulations 2010 (UK Government 2010) specifies maximum concentration thresholds for key air pollutants.
This indicator measures the removal of air pollutants attributable to NCF planting schemes. Tree planting can improve air quality by removing pollutants from the atmosphere (Bignal, Ashmore, and Power 2004) through:
- the absorption of gaseous pollutants via stomatal uptake (“pores” on leaves);
- the deposition of pollutants on external surfaces such as leaves and bark.
The indicator focuses on six pollutants (PM2.5, PM10, SO2, NO2, O3, NH3) highlighted in the UK Natural Capital Accounts (Office for National Statistics 2024c). We used unrounded data of pollution removal by habitat type, provided at local authority level, from the UK Natural Capital Accounts (Office for National Statistics 2024b). For fine particulate matter (PM2.5), a particularly hazardous pollutant (Sangkham et al. 2024), we modelled the planting’s capacity for removal over time, recognising that it takes several years or decades for trees to develop the canopy structure required for optimal removal.
5.2 Key results
NCF planting is predicted to remove, once the trees reach maturity, between 310 - 336 more tonnes of airborne pollutants (all types) annually than the baseline (Table 5.1). This is equivalent in weight to around 18 fully loaded London buses. Ozone (O3) accounts for 60% of this, followed by Particulate Matter (PM10) (23%).
| Pollutants removed (tonnes/y) |
| |||||
|---|---|---|---|---|---|---|---|
Region | NH3 | NO2 | O3 | PM10 | PM2.5 | SO2 | Total |
Yorkshire and The Humber | 10.69 | 1.19 | 44.45 | 16.79 | 6.40 | 4.86 | 77.99 |
South West | 3.76 | 0.55 | 34.33 | 14.24 | 4.58 | 2.08 | 54.97 |
North West | 5.09 | 0.56 | 28.25 | 8.90 | 3.26 | 2.79 | 45.59 |
North East | 2.69 | 0.72 | 22.41 | 7.60 | 2.55 | 1.41 | 34.82 |
East Midlands | 4.45 | 0.54 | 19.66 | 7.80 | 3.04 | 1.85 | 34.31 |
East of England | 2.91 | 0.30 | 16.61 | 8.44 | 3.08 | 1.80 | 30.06 |
South East | 1.74 | 0.51 | 16.34 | 7.37 | 2.48 | 1.36 | 27.32 |
West Midlands | 1.73 | 0.22 | 9.74 | 3.61 | 1.44 | 0.68 | 15.98 |
London | 0.22 | 0.05 | 1.27 | 0.30 | 0.13 | 0.11 | 1.95 |
Total | 33.29 | 4.65 | 193.06 | 75.04 | 26.96 | 16.94 | 322.98 |
NCF planting is generally predicted to have slightly higher removal rates in areas with high populations, particularly London (Figure 5.1). When pollutant concentrations are higher to begin with, there is higher deposition on vegetation.
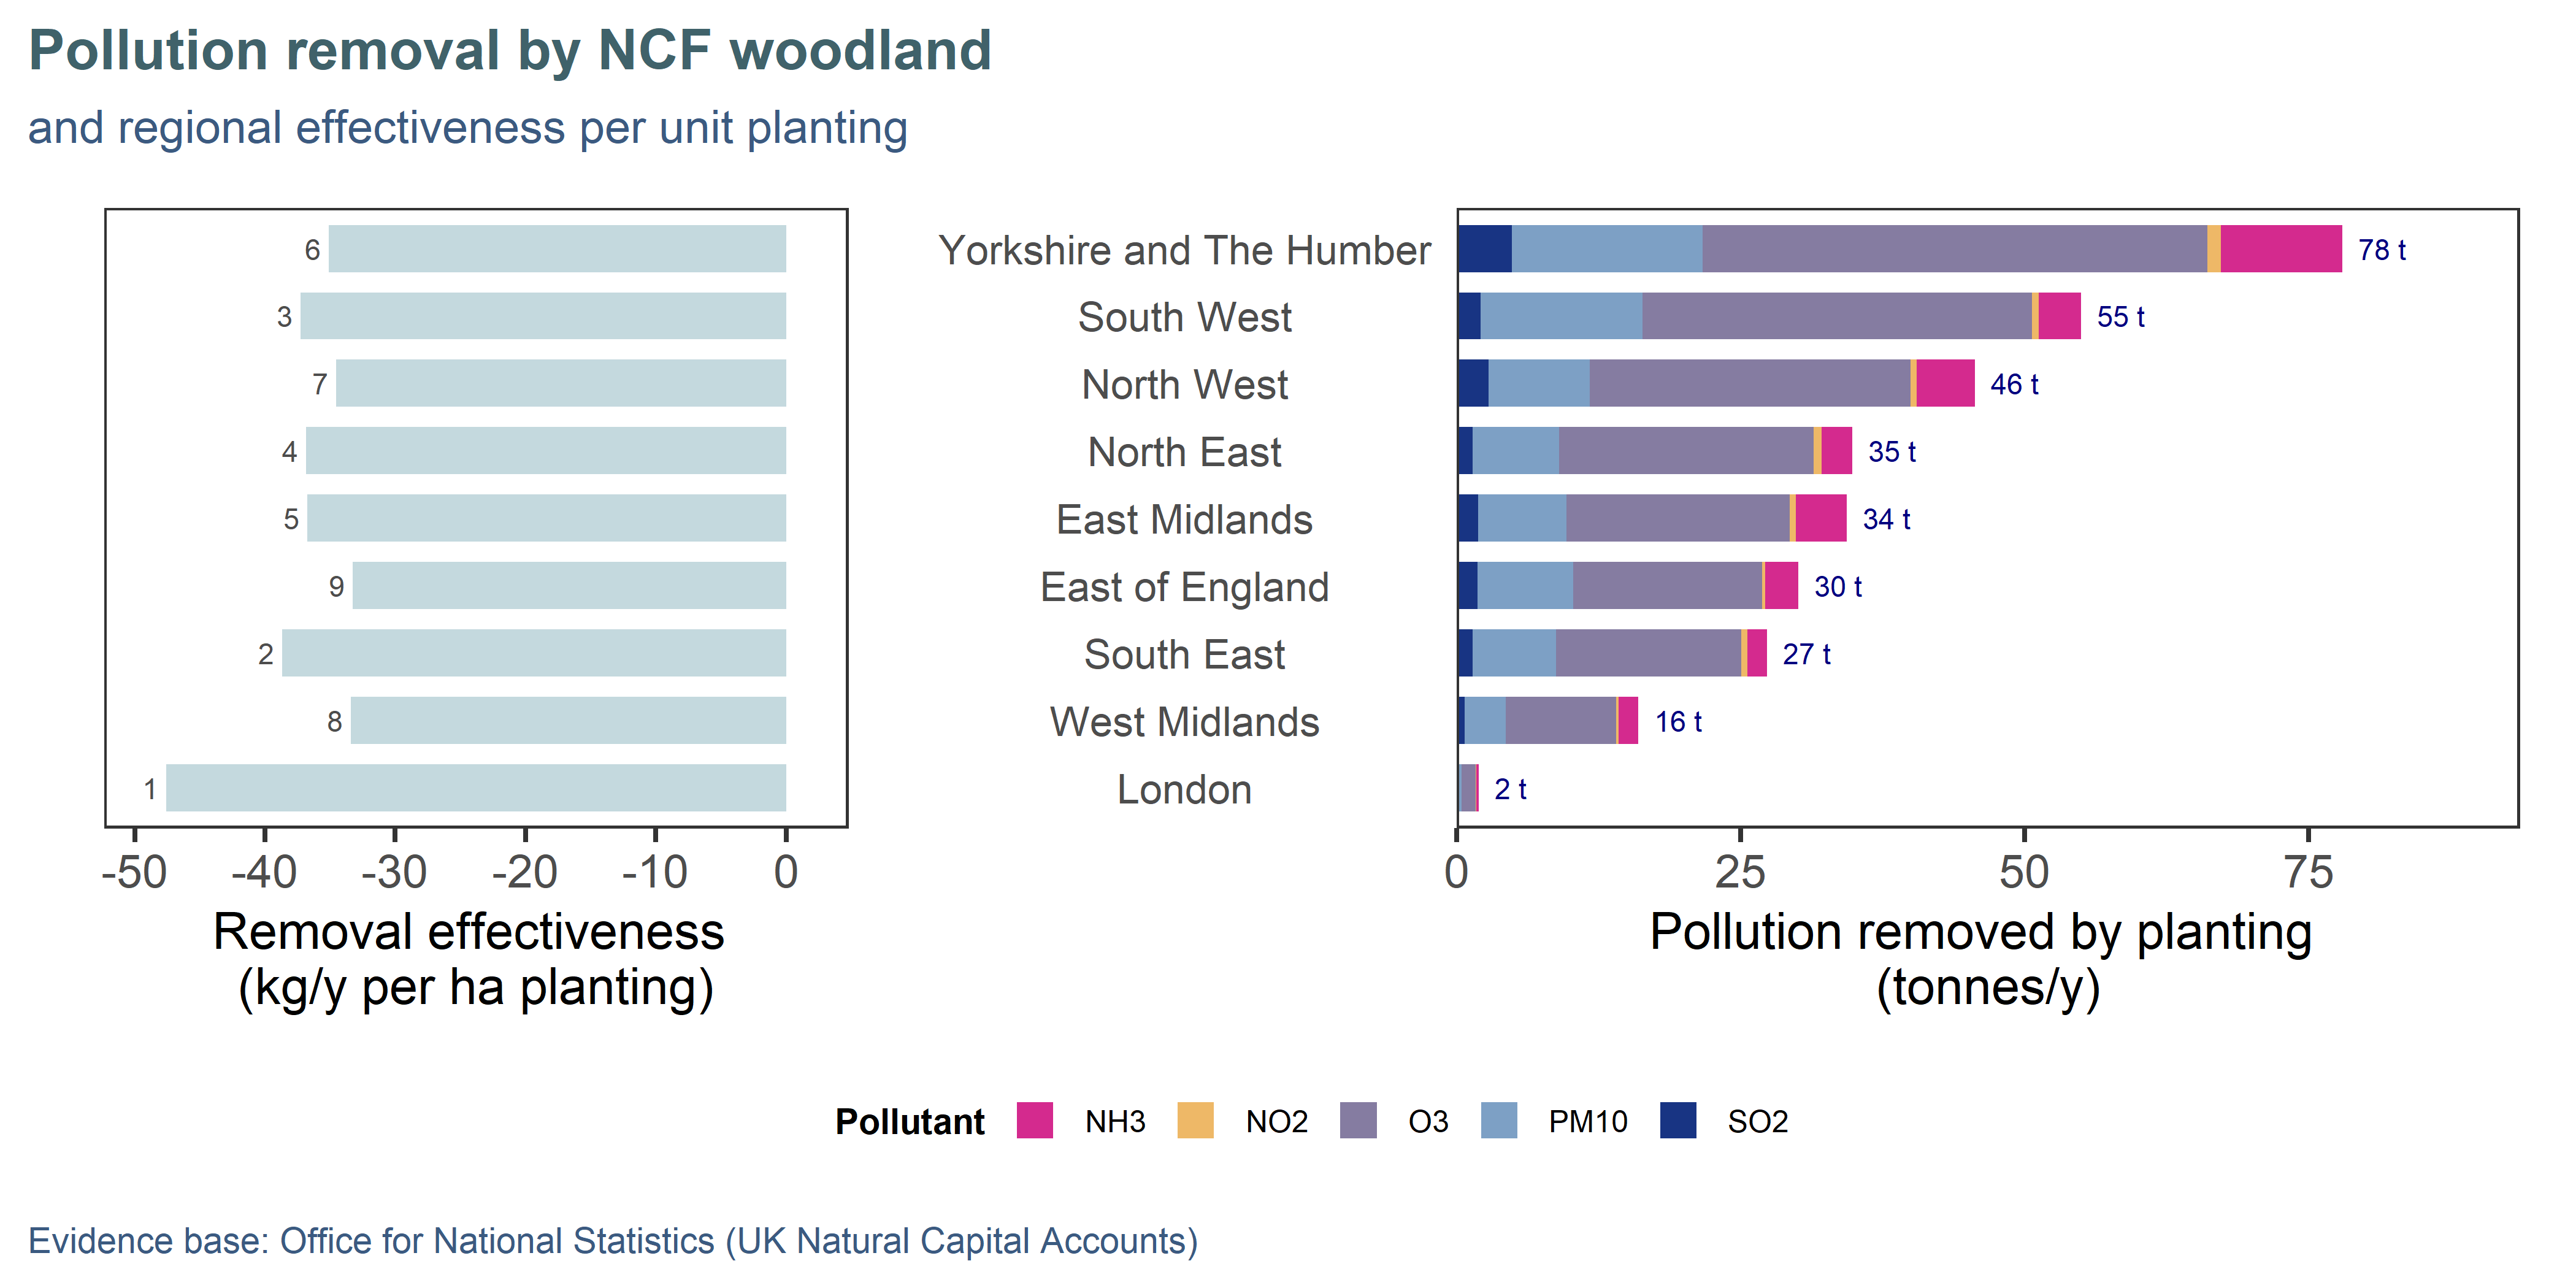
Figure 5.1: Annual projected air pollution removal by NCF planting (at maturity) compared to previous land use (right), and regional effectiveness per unit area of planting (left). Regions are ordered top-down by decreasing area of planting. Effectiveness ranking is annotated on the left panel, 1 being the best.
The values reported above do not account for lag effects in the tree canopies being sufficiently developed to provide the service, so are an estimate of the potential of the planting at maturity. Research has shown that for fine particulate matter (PM2.5), street trees initially remove at a slow rate, accelerating quickly to a relatively constant, fast rate at maturity (Qin et al. 2020). This leads to an exponential increase in the cumulative curve initially, levelling to a relatively linear increase once the trees are mature (Figure 5.2). When accounting for the growing capacity of the young NCF trees to capture airborne pollutants as they grow, we predict a total cumulative removal of around 391 tonnes of PM2.5 by 2050. This forecast method was only applied to PM2.5, as information was not available for other pollutants.
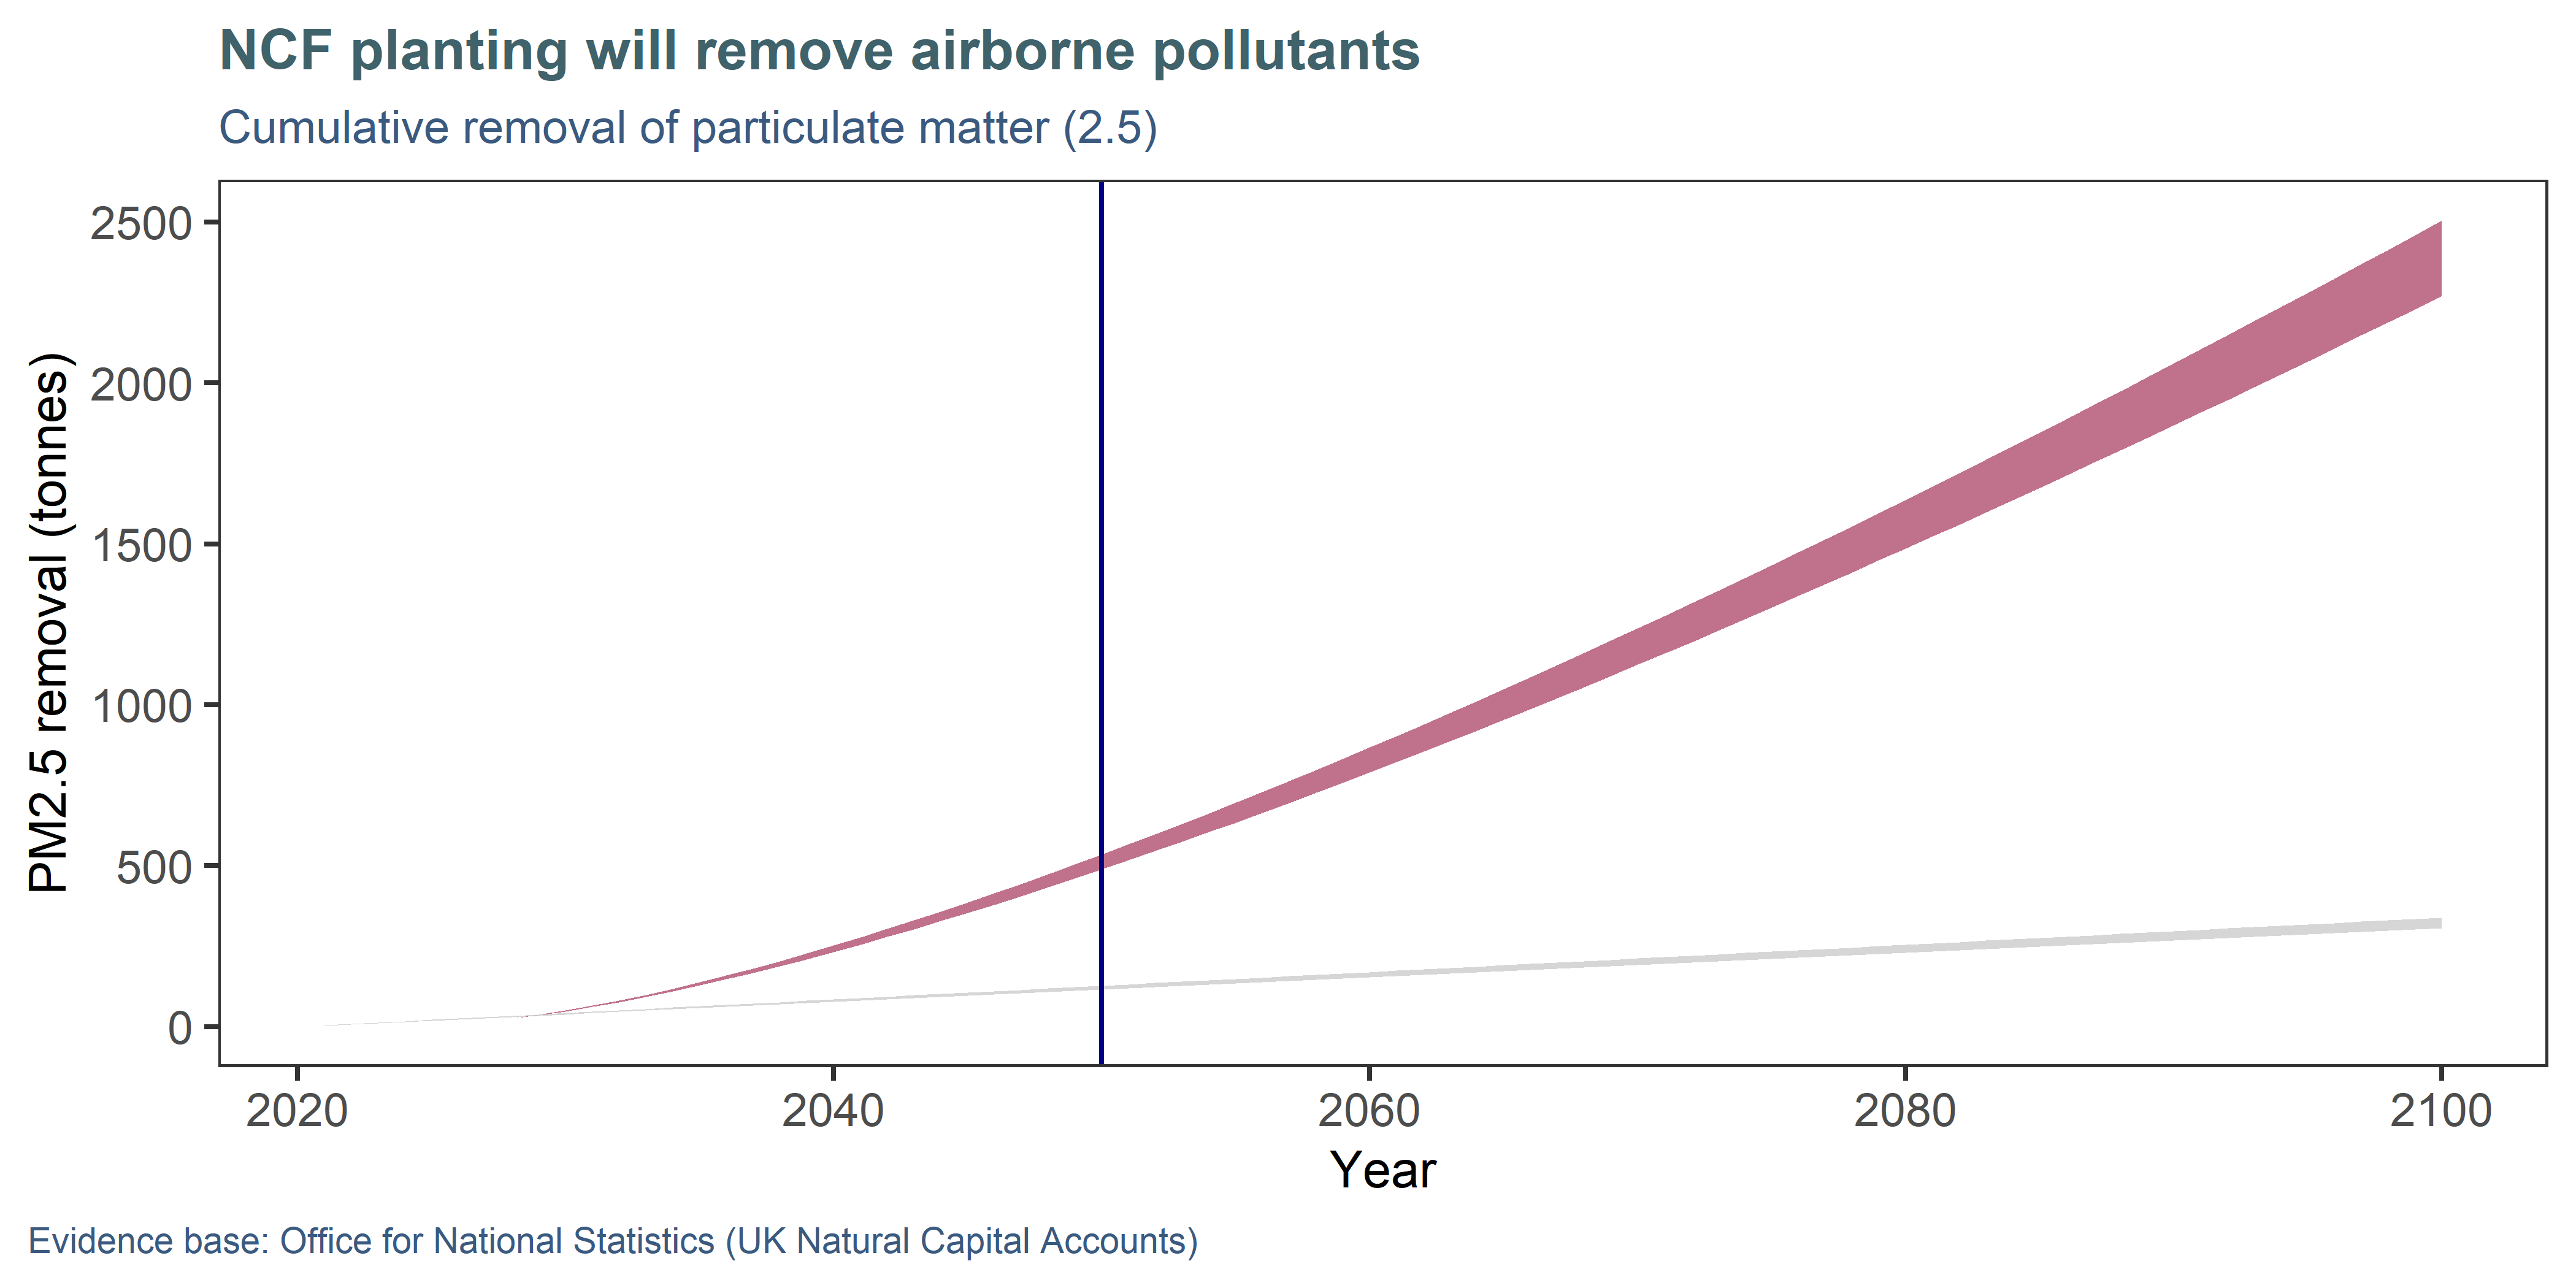
Figure 5.2: Projected cumulative removal of fine particulate matter (PM2.5) until 2100, modelled using pollutant reduction-age curves from Qin et al. (2020) and data from the UK Natural Capital Accounts. The band represents a likely range of estimates, to represent uncertainty in the role of parkland and sparse planting (which was treated as woodland in one scenario, and as grassland in another). The red curve represents NCF planting, whereas the grey line represents ‘business as usual’ if baseline habitats were left intact and continued to remove pollution at their original rate.
5.3 Approach and assumptions
The air quality model uses removal rates by habitat type from the UK Natural Capital Accounts (Office for National Statistics 2024b), for:
- broadleaf woodland;
- coniferous woodland;
- coastal margins;
- enclosed farmland;
- freshwater, wetlands and floodplains;
- mountains, moorland and heath;
- semi-natural grassland;
- urban grassland;
- urban trees.
Rates of capture vary not only by habitat but also by local authorities, reflecting differing pollutant concentrations in different regions of England. Pollution concentrations in the atmosphere are decreasing over time because of cleaner technology (Institute for Fiscal Studies 2024), so pollutant removal values were reduced to a 2030 value using reduction proportions for each LA from the ONS data (Office for National Statistics 2024a), so that removal was not overestimated.
This indicator calculates representative removal for an average year and location in a local authority. In reality, air quality issues can play out at very fine scales such as street canyons (Gromke and Ruck 2012). Predicting air quality at a specific point requires complex modelling of wind patterns, pollution sources and their interaction with the landscape. This indicator does not either consider temporal cycles in pollution emissions (e.g. peak traffic) and vegetation activity (Linden et al. 2023), which can also affect pollutant concentrations on a daily (leaf stomata close at night) and seasonal basis (with broadleaved losing leaves in winter). Finally, it does not consider the fact that some trees can worsen local air quality through the emission of allergens (pollen) or Biogenic Volatile Organic Compounds (BVOCs) (Nemitz et al. 2020).
The analysis assumes normal, healthy tree growth and does not account for the potential impact of pollutant deposition on growth. In reality, deposited pollution can lead to increased soil nitrogen and soil acidification, affecting plant survival and growth by reducing the availability of other nutrients to plants, as well as tolerance to drought stress (Rowe et al. 2024). Moreover, ozone (O3) can affect the ability of woodland trees to photosynthesize and therefore reduce growth rates (Sharps et al. 2024).
When baseline habitats or the planting reflected sparsely wooded areas (e.g. scrub, wood pasture), we used two scenarios to give a results range between which we’d expect the correct value to fall. These habitat types were treated either as a) full woodland cover or B) full grassland cover.
To produce a curve showing PM2.5 removal over time (Figure 5.2), we fitted our data to published curves of the relationship between age and PM2.5 reduction on busy streets (Qin et al. 2020) in China for the cedar Cedrus deodara and maple Acer buergerianum. These two species were used as model trees for coniferous and broadleaf woodland, respectively. This assumes that these Asian trees can be used as a model species for the change in relative pollution removal over time. Importantly, only the shape of the relationship between tree growth and pollutant capture was used, and fitted to the absolute pollutant removal values from the UK Natural Capital Accounts.