Chapter 7 Water Quality
7.1 Indicator definition
In England, 84% of surface waters do not achieve a good ecological status (Environment Agency 2024a). Pressures from agriculture and rural land management account for around 40% of the failures to reach good condition (Environment Agency 2021a), making it the primary sector responsible for water quality issues, ahead of the water industry (ca. 23%). Agricultural land typically receives nutrient inputs from fertilisers and animal waste, which can lead to diffuse pollution affecting water bodies and groundwater. In excess, nutrients such as nitrogen (N) and phosphorus (P) in the water promote algal blooms which deplete oxygen levels and reduce biodiversity.
This indicator measures nutrient removal attributable to the NCF schemes. It focuses on nitrogen (N) and phosphorus (P), which are important exports of agricultural land and well documented within the two key evidence bases we used: the Farmscoper tool (ADAS 2025) and the Nutrient Neutrality guidelines (Natural England 2022). This allowed the application of the indicator nationally and for all planting. As a simpler descriptive metric, we also provide a breakdown of the planting in relation to the Water Framework Directive ecological quality status of water catchments.
The indicator assumes that the primary way by which woodland creation improves water quality is the replacement of polluting land use types by less polluting ones (cessation of inputs). Trees can also enhance nutrient removal processes in several ways (Natural England 2024). They create a more porous soil texture via roots and leaf litter accumulation. Reduced compaction, increased infiltration and a slower water flow mean higher chances of trapping pollutants before they reach a water course. Additionally, the increase in organic carbon and soil chemistry changes associated with trees can promote the activity of micro-organisms responsible for denitrification, and improve the binding of phosphorus. Finally, trees act as windbreaks, and can reduce wind erosion of soils which otherwise might contribute additional nutrient inputs to water systems.
7.2 Key results
NCF sites are expected to generate a removal of 202,412 kg N and 3,944 kg P annually compared to the prior habitats they were planted on. This is equivalent in weight to 11 fully loaded London buses. By 2050, NCF planting will prevent 5,600 tonnes N and 110 tonnes P from entering the landscape compared to “business as usual” (assuming a constant habitat baseline with the prior land use persisting). It is important to note that while phosphorus loads and removal values are much smaller than nitrogen, phosphorus is a potent chemical responsible for most failures to achieve good ecological status (Environmental Audit Committee 2022).
| Pollutants removed (annually) | |
|---|---|---|
Region | kg N | kg P |
Yorkshire and The Humber | 39,010 | 824 |
South West | 38,318 | 691 |
East Midlands | 27,554 | 341 |
North West | 25,990 | 856 |
East of England | 25,298 | 273 |
South East | 19,071 | 273 |
North East | 14,193 | 455 |
West Midlands | 12,738 | 209 |
London | 238 | 22 |
Total | 202,412 | 3,944 |
Absolute removal is predicted to be highest in Yorkshire and the Humber (Figure 7.1), where there is the most planting. However, in terms of standardised removal potential (kg removed per hectare of planting), schemes in the East Midlands, East of England, South East and West Midlands seem particularly effective in decreasing nitrogen inputs, a reflection of the higher nutrient loads in these regions. They are areas with more intensive agriculture, including most of the country’s arable production, and changing land use is therefore likely to be most influential in reducing N inputs to the land. In contrast, the North West has the highest P export rates, and therefore a higher removal rate (effectiveness). A major pathway of phosphorus pollution in surface runoff, more likely to occur in hilly areas with high rainfall (Johnston and Dawson 2005). Woodland creation can help slow runoff and store water (see Chapter 6), providing both flood regulation and water quality benefits.
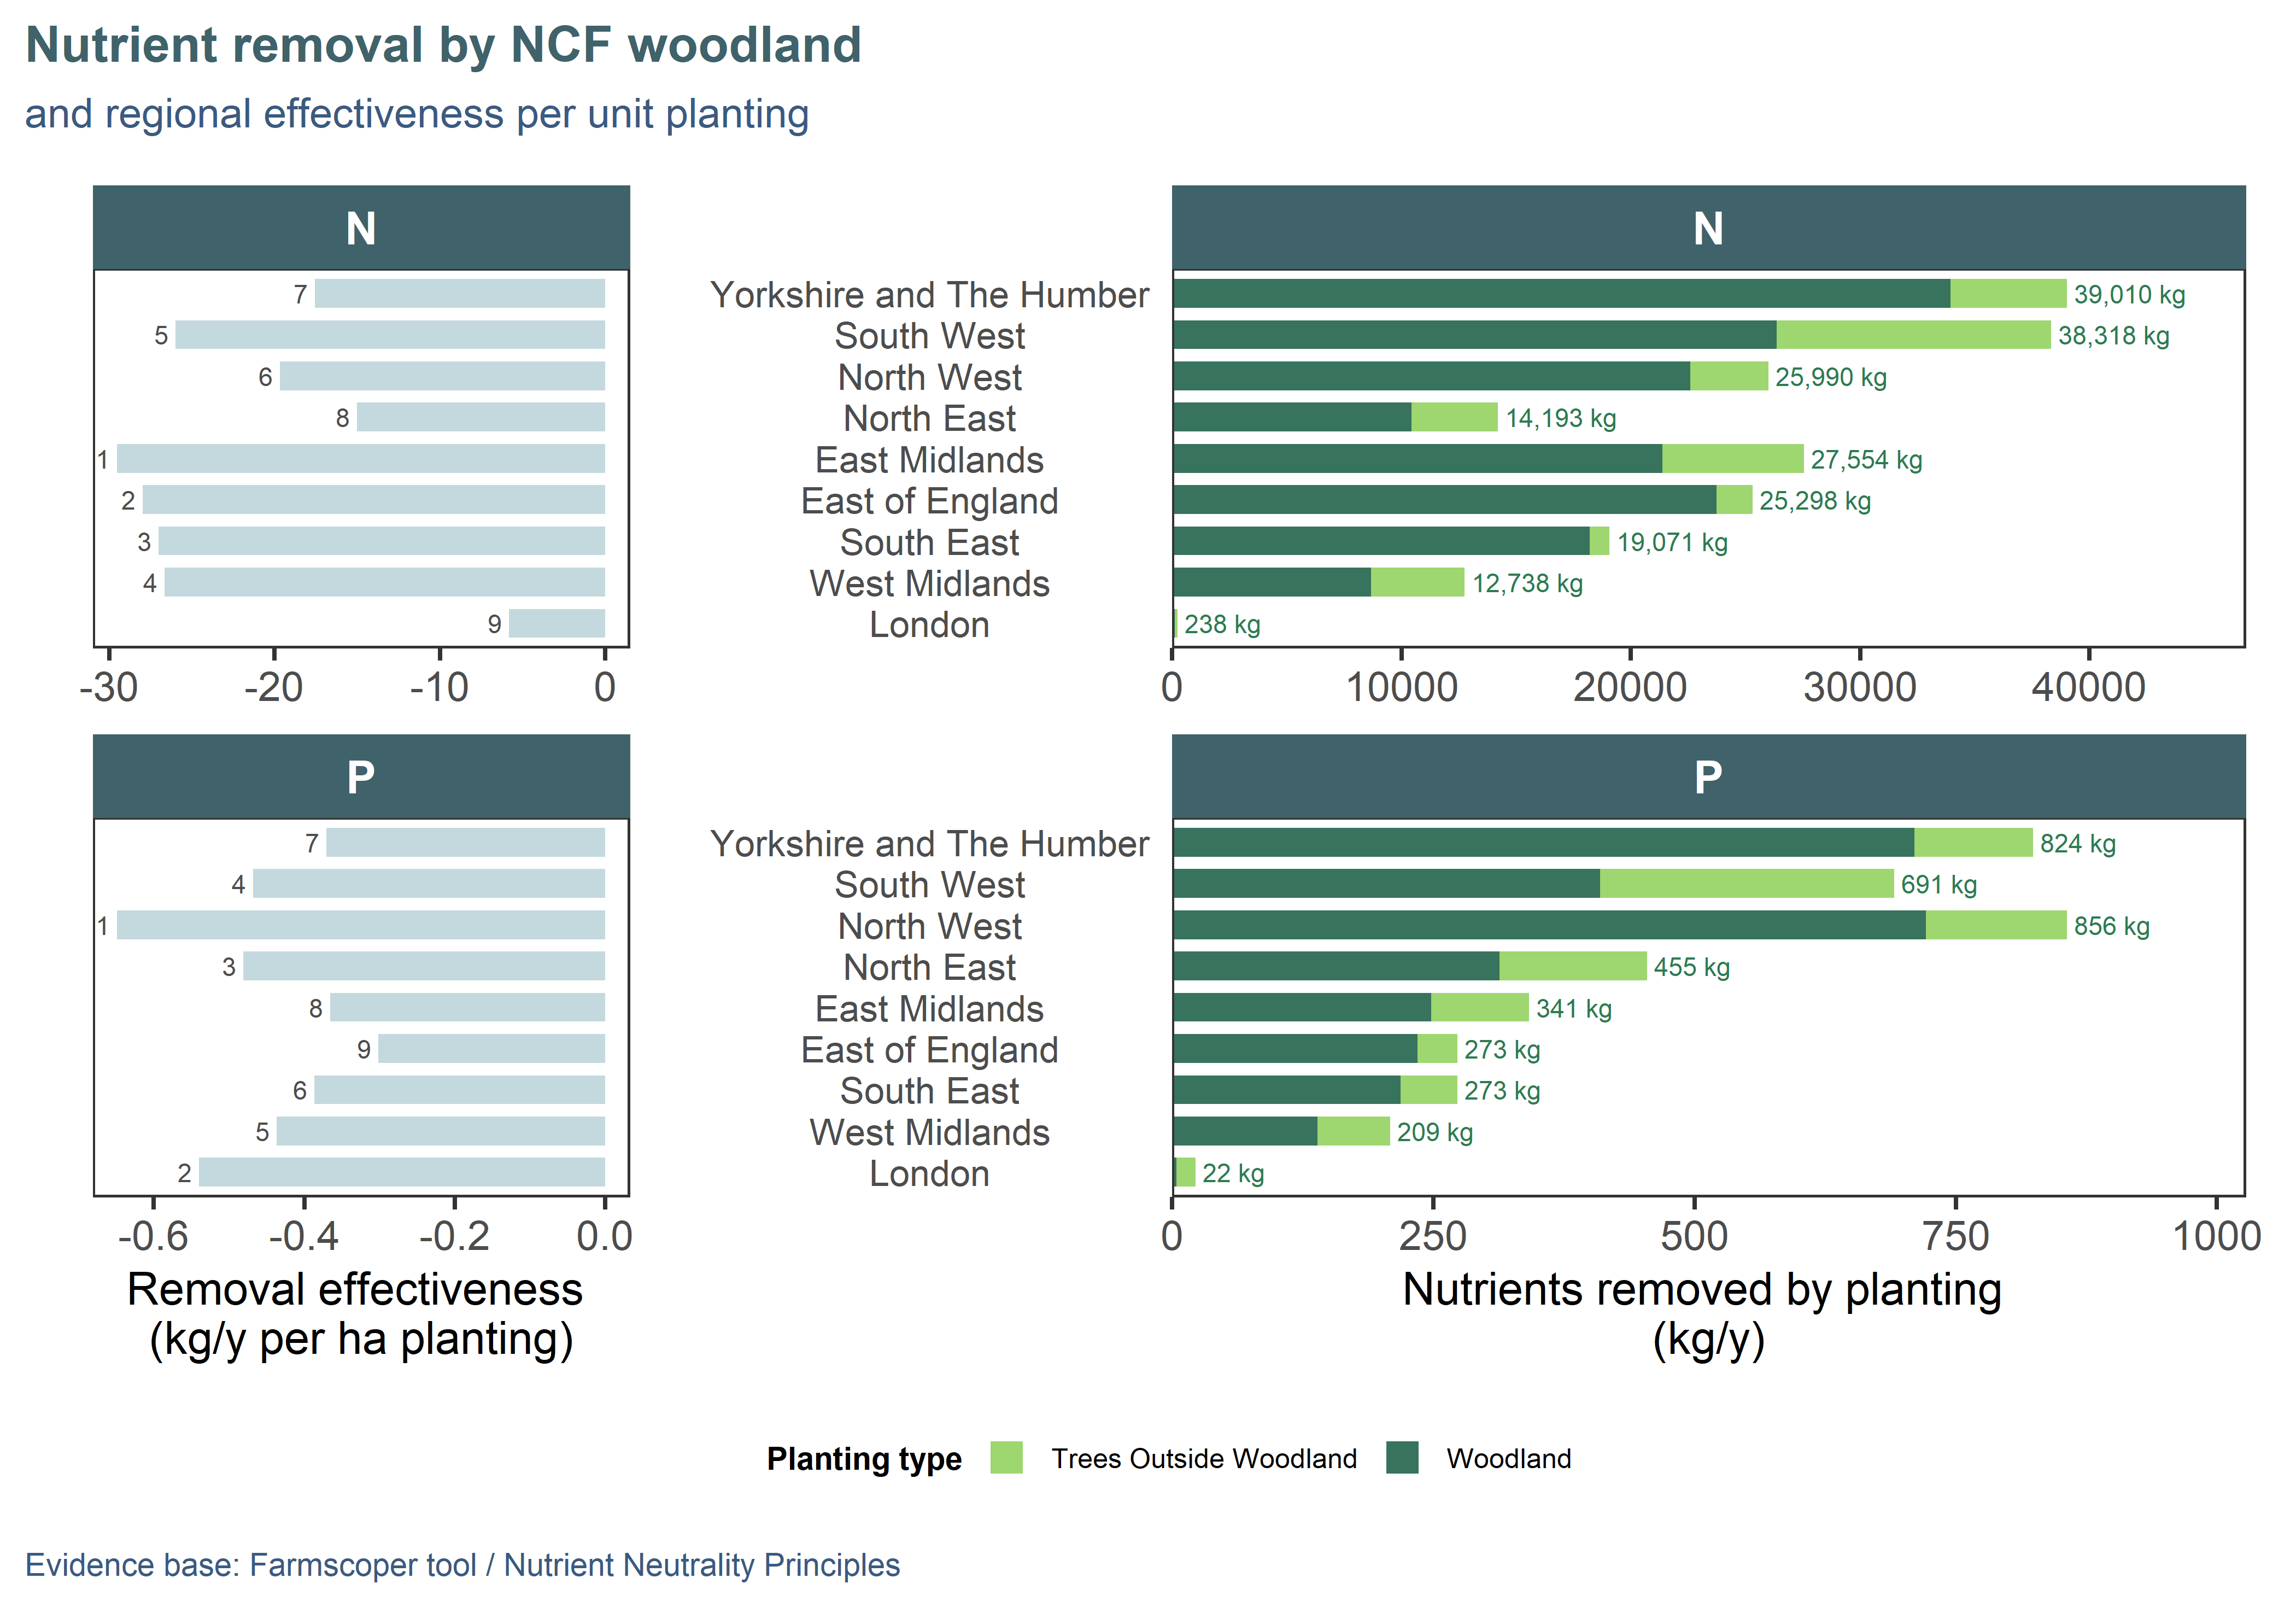
Figure 7.1: Annual nitrogen (N) and phosphorus (P) removal by NCF planting compared to previous land use. Regions are ordered top-down by decreasing area of planting: total reduction (right) and effectiveness (left; pollution removed per unit area of planting) are a function of catchment-level properties such as farming type, soil characteristics, urban land cover and rainfall. Effectiveness ranking is annotated on the left panel, 1 being the best.
While woodland creation is a nature-based solution to diffuse pollution, it cannot be effective where water quality issues arise from events like sewage overflow. The Environment Agency publishes, for all waterbodies, a list of reasons for not achieving good status, providing insight into specific pressures within catchments (Environment Agency 2023a). We aggregated the data at river catchment level (Environment Agency 2025b) and identified the catchments which met these two criteria:
- at least 50% of waterbodies in the catchment are in the Poor/Bad/Fail categories; AND
- at least 20% of waterbodies in the catchment have the agriculture sector mentioned as a pressure
As NCF schemes are predominantly based on agricultural land (NCF Planting), we took this to represent key catchments where woodland creation could be most effective in improving water quality. There are 591 sites (22% of NCF planting) located in 327 priority catchments (Figure 7.2) (Environment Agency 2023a). These NCF sites are predicted to reduce N pressure by 2,376 tonnes and P pressure by 41 tonnes by 2050 compared to the prior land use. The spread of NCF sites in these catchments is the same as would be expected were they randomly located. Our catchment classification could be reused or adapted in a spatial prioritisation exercise to target planting for water quality benefits in a successor programme.
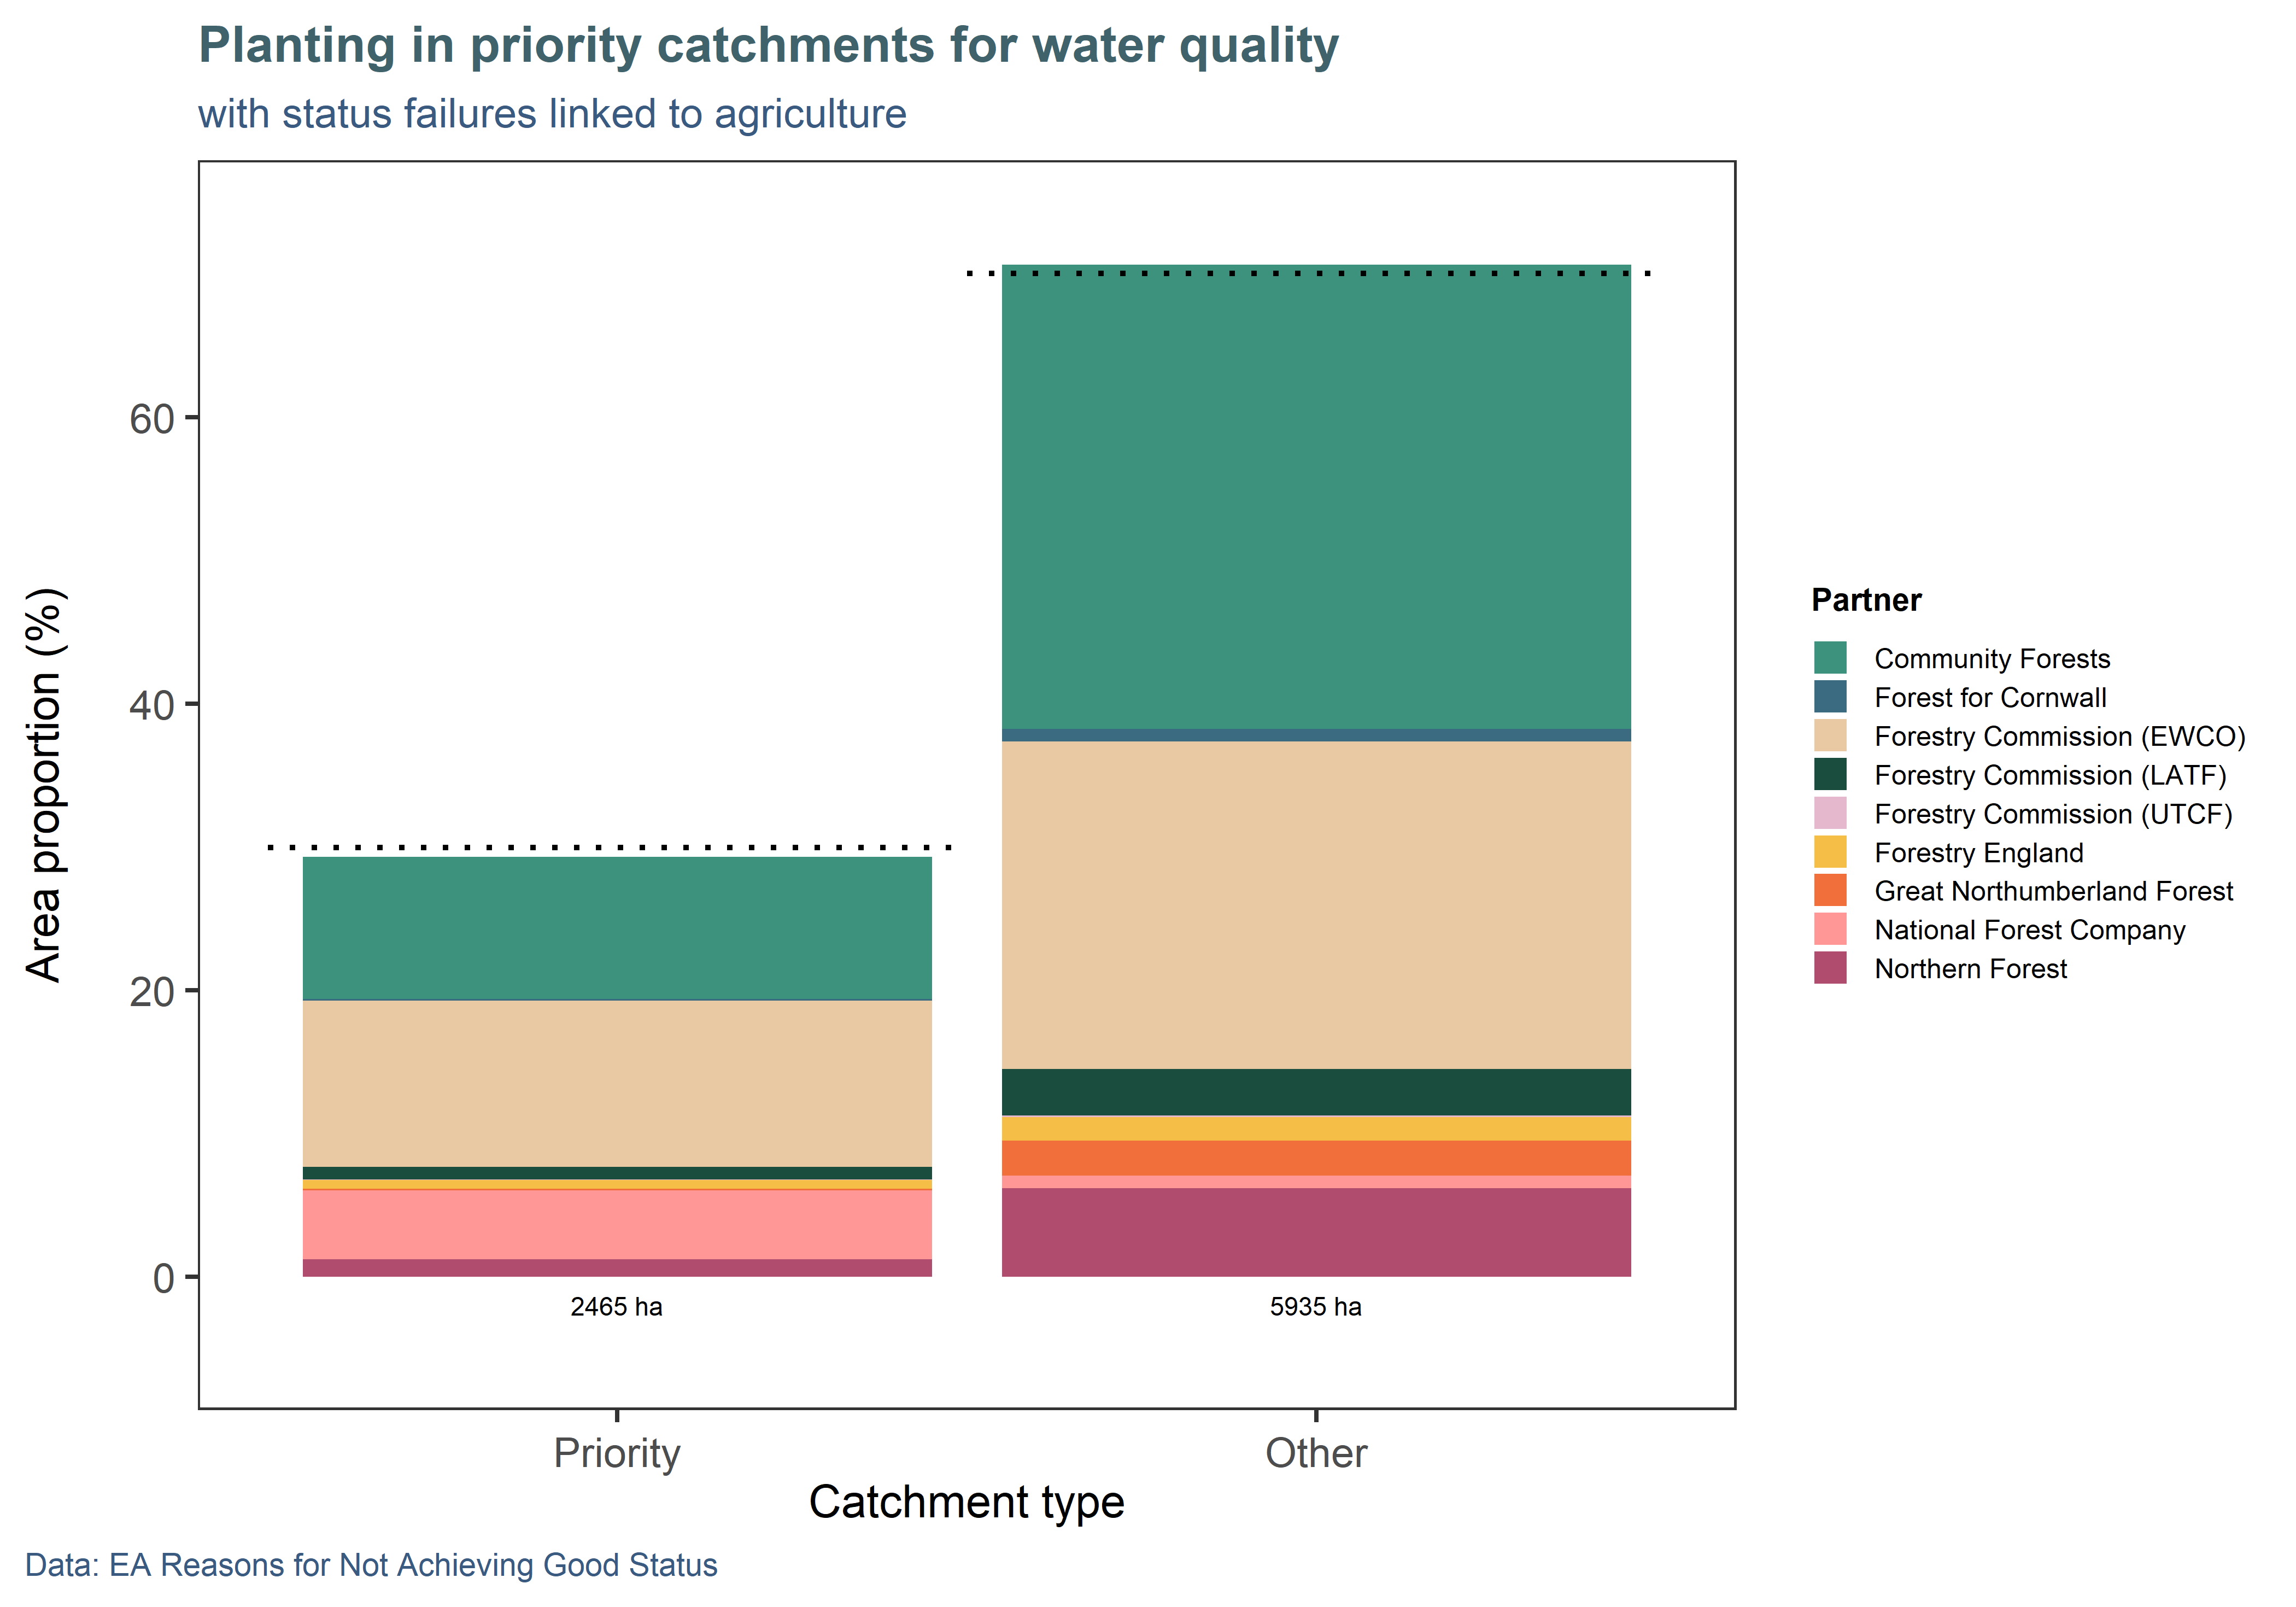
Figure 7.2: Around a third of NCF sites are planted in priority catchments for water quality, proportional to their national occurrence. (Bars indicate planting in each category, while the dotted line indicate expected proportions based on the national dataset.) A priority catchment was defined as having over 50% of its water bodies in poor or bad condition, and where agricultural pressures account for over 20% of identified threats. NB: Around 620 ha of planting (7%) are not included as they fall outside the coverage of the river catchment map, which does not cover coastal areas.
7.3 Approach and assumptions
The model for this indicator assigns nutrient export rates (for N and P) to all habitats, using the following evidence sources:
- Agricultural land: assigns N (ammonia + nitrate) and P export rates at catchment level. We derived a spatial file of nutrient losses by catchment by running the Farmscoper UPSCALE tool (ADAS 2025) separately for each surface water operational catchment (Environment Agency 2024b) (excluding transitional and coastal catchments, for which there were no data available). We ran the UPSCALE tool with default settings, letting it create representative farms (in terms of number, area and farming type, from the Defra agricultural census) and conditions such as soils and climate for each catchment, using its built-in database (ADAS 2025).
- Semi-natural land: assigns a flat rate (not spatially variable) to all semi-natural habitat types, extracted from the Nutrient Neutrality (Natural England 2022) methodology.
- Urban land: assigns a rate to urban land based on residential, commercial or open/greenspace land use type. This rate is spatially variable as it depends on rainfall (Natural England 2022), so we have created a gridded spatial lookup using MetOffice annual precipitation data at 12km resolution (Hollis 2022).
This means that this indicator, while not a fully spatial model, reports values that are spatially sensitive to catchment farming practices and regional climate, allowing to identify areas where woodland creation is expected to make a particularly efficient improvement. Farm-level management is not considered, so results are not meaningful at the site level. Moreover, catchments are subject to multiple pressures, so it not guaranteed that alleviating one would make a significant difference to water quality.
This indicator provides a first view of potential water quality benefits from planting that help inform where woodland creation is/could be most effective. However, it does not consider the following:
- Other pollutants: the indicator could be expanded to work with other agricultural pollutants quantified by Farmscoper (e.g. fecal indicator organisms, sediments, pesticides); however, more evidence would need to be found for their export coefficients in semi-natural and urban areas. The Woodland Water Code (Nisbet et al. 2025), due March 2026, should provide a verified, evidence-based method for calculating water quality benefits for woodland.
- Soil type and hydrology: most of the removal processes occur belowground and it is therefore important that flows carrying nutrient loads infiltrate the soil before reaching a water course. Farmscoper uses catchment-level soil information but a full spatial model would consider soils at a finer scale and include hydrological indicator such as the distance to the nearest watercourse to fully quantify risk.
- Lag periods: even after a rapid decrease or cessation of N-P inputs, soil and water stock can take years or decades to reduce (Nisbet et al. 2011). These time effects were not considered, which is why we only report an annual rate for this indicator.