Chapter 2 NCF Planting
2.1 Planting statistics
The planting data collected for this work amounts to 5,630 individual planting sites, covering 8,724 ha of declared planting (approx. 11 million trees) across 259 local authorities. This is the most complete spatial view of Nature for Climate planting gathered to date (Figure 2.1), and aligns well (Table 2.1) with official woodland creation statistics (Forestry Commission 2024b). All analyses in this report used the spatial dataset (“calculated area” in Table 2.1) as input.
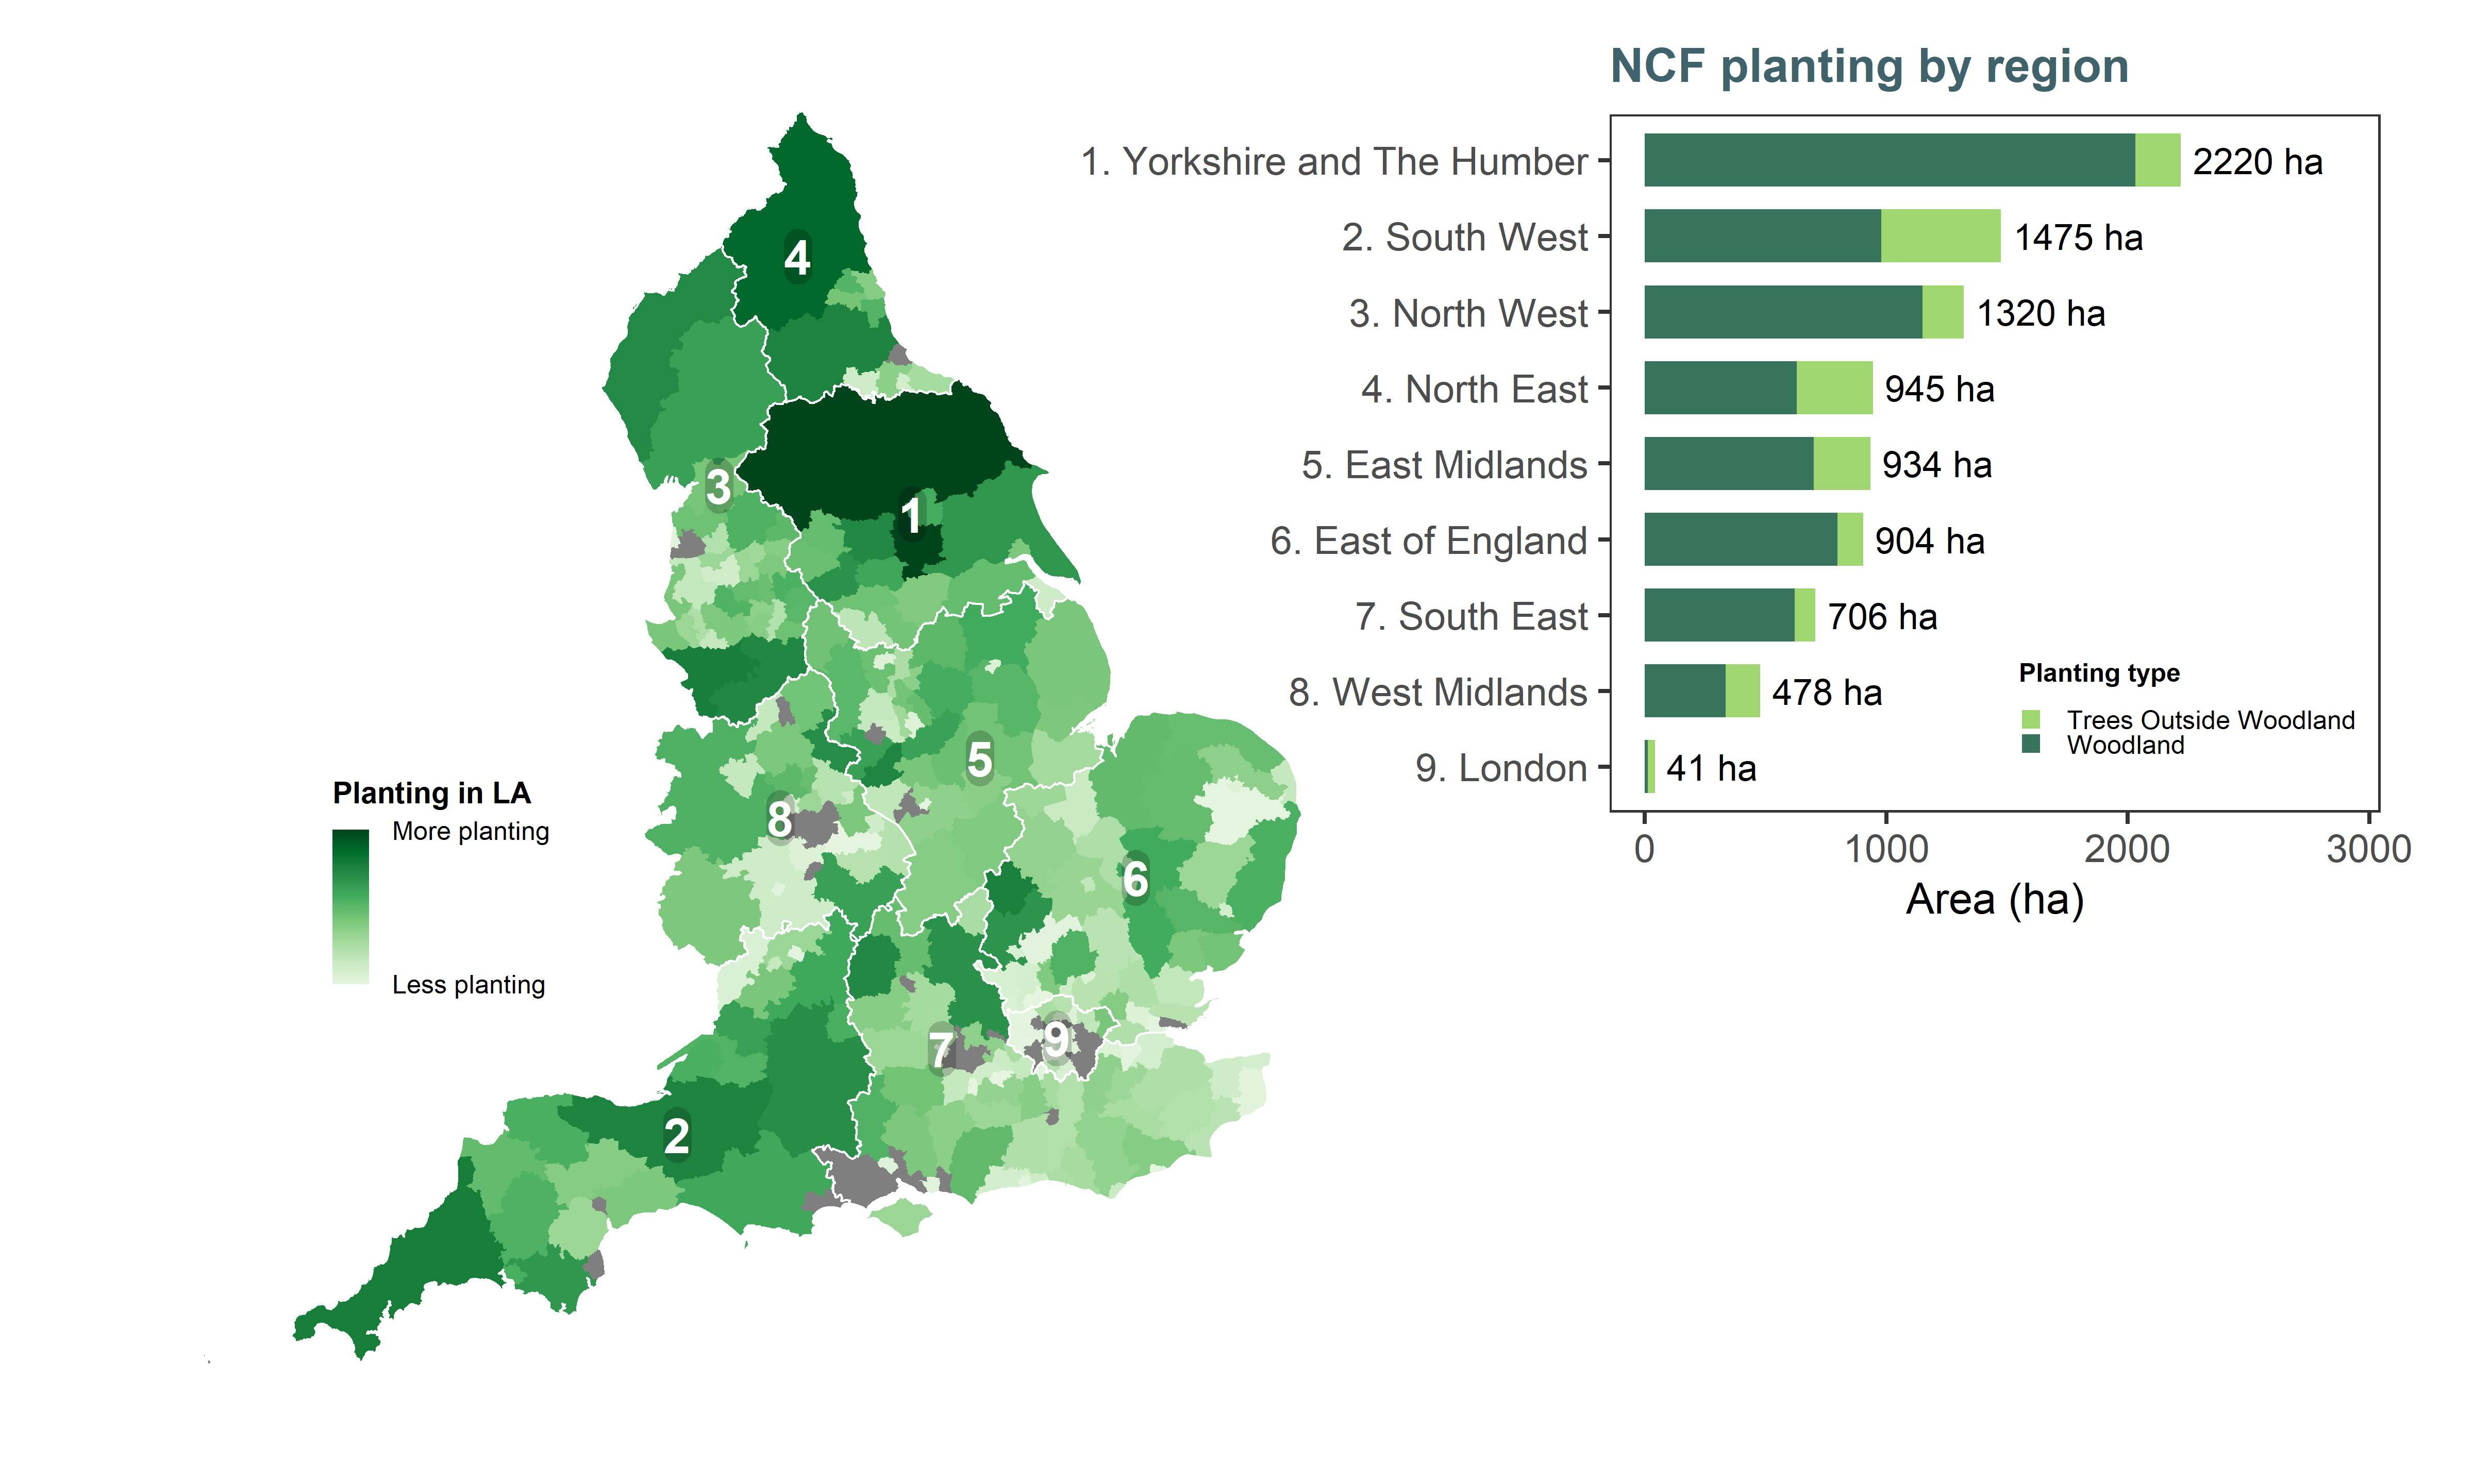
Figure 2.1: Overview of NCF planting across England. Darker areas indicate local authorities where there was more NCF-funded woodland creation (log scale for better visualisation). Regions are ordered top-down from greatest to smallest amount of planting. Hectares shown on the bar plot are calculated areas from the GIS planting masterfile.
| Area (ha) | ||
|---|---|---|---|
Partner | Official | Declared | Calculated |
England's Community Forests | 4,024 | 4,026 | 3,912 |
Forestry Commission (England Woodland Creation Offer) | 2,707 | 2,664 | 2,991 |
Northern Forest | 738 | 584 | 651 |
National Forest Company | 434 | 418 | 480 |
Forestry Commission (Local Authority Treescapes Fund) | 424 | 496 | 392 |
Forestry England | 224 | 311 | 191 |
New Woodland Creation Partnerships | 84 | 206 | 385 |
Forestry Commission (Urban Tree Challenge Fund) | 54 | 20 | 19 |
Total | 8,689 | 8,724 | 9,023 |
Planting partners have delivered varying proportions of woodland versus trees outside woodland (Figure 2.2). Mechanisms like the Local Authority Treescapes Fund (LATF) and the Urban Tree Challenge Fund (UTCF) are delivered primarily in urban and peri-urban areas and focus on increasing tree cover outside woodland. The newest woodland creation partnerships (Forest for Cornwall and Great Northumberland Forest) have a strong focus on agroforestry.
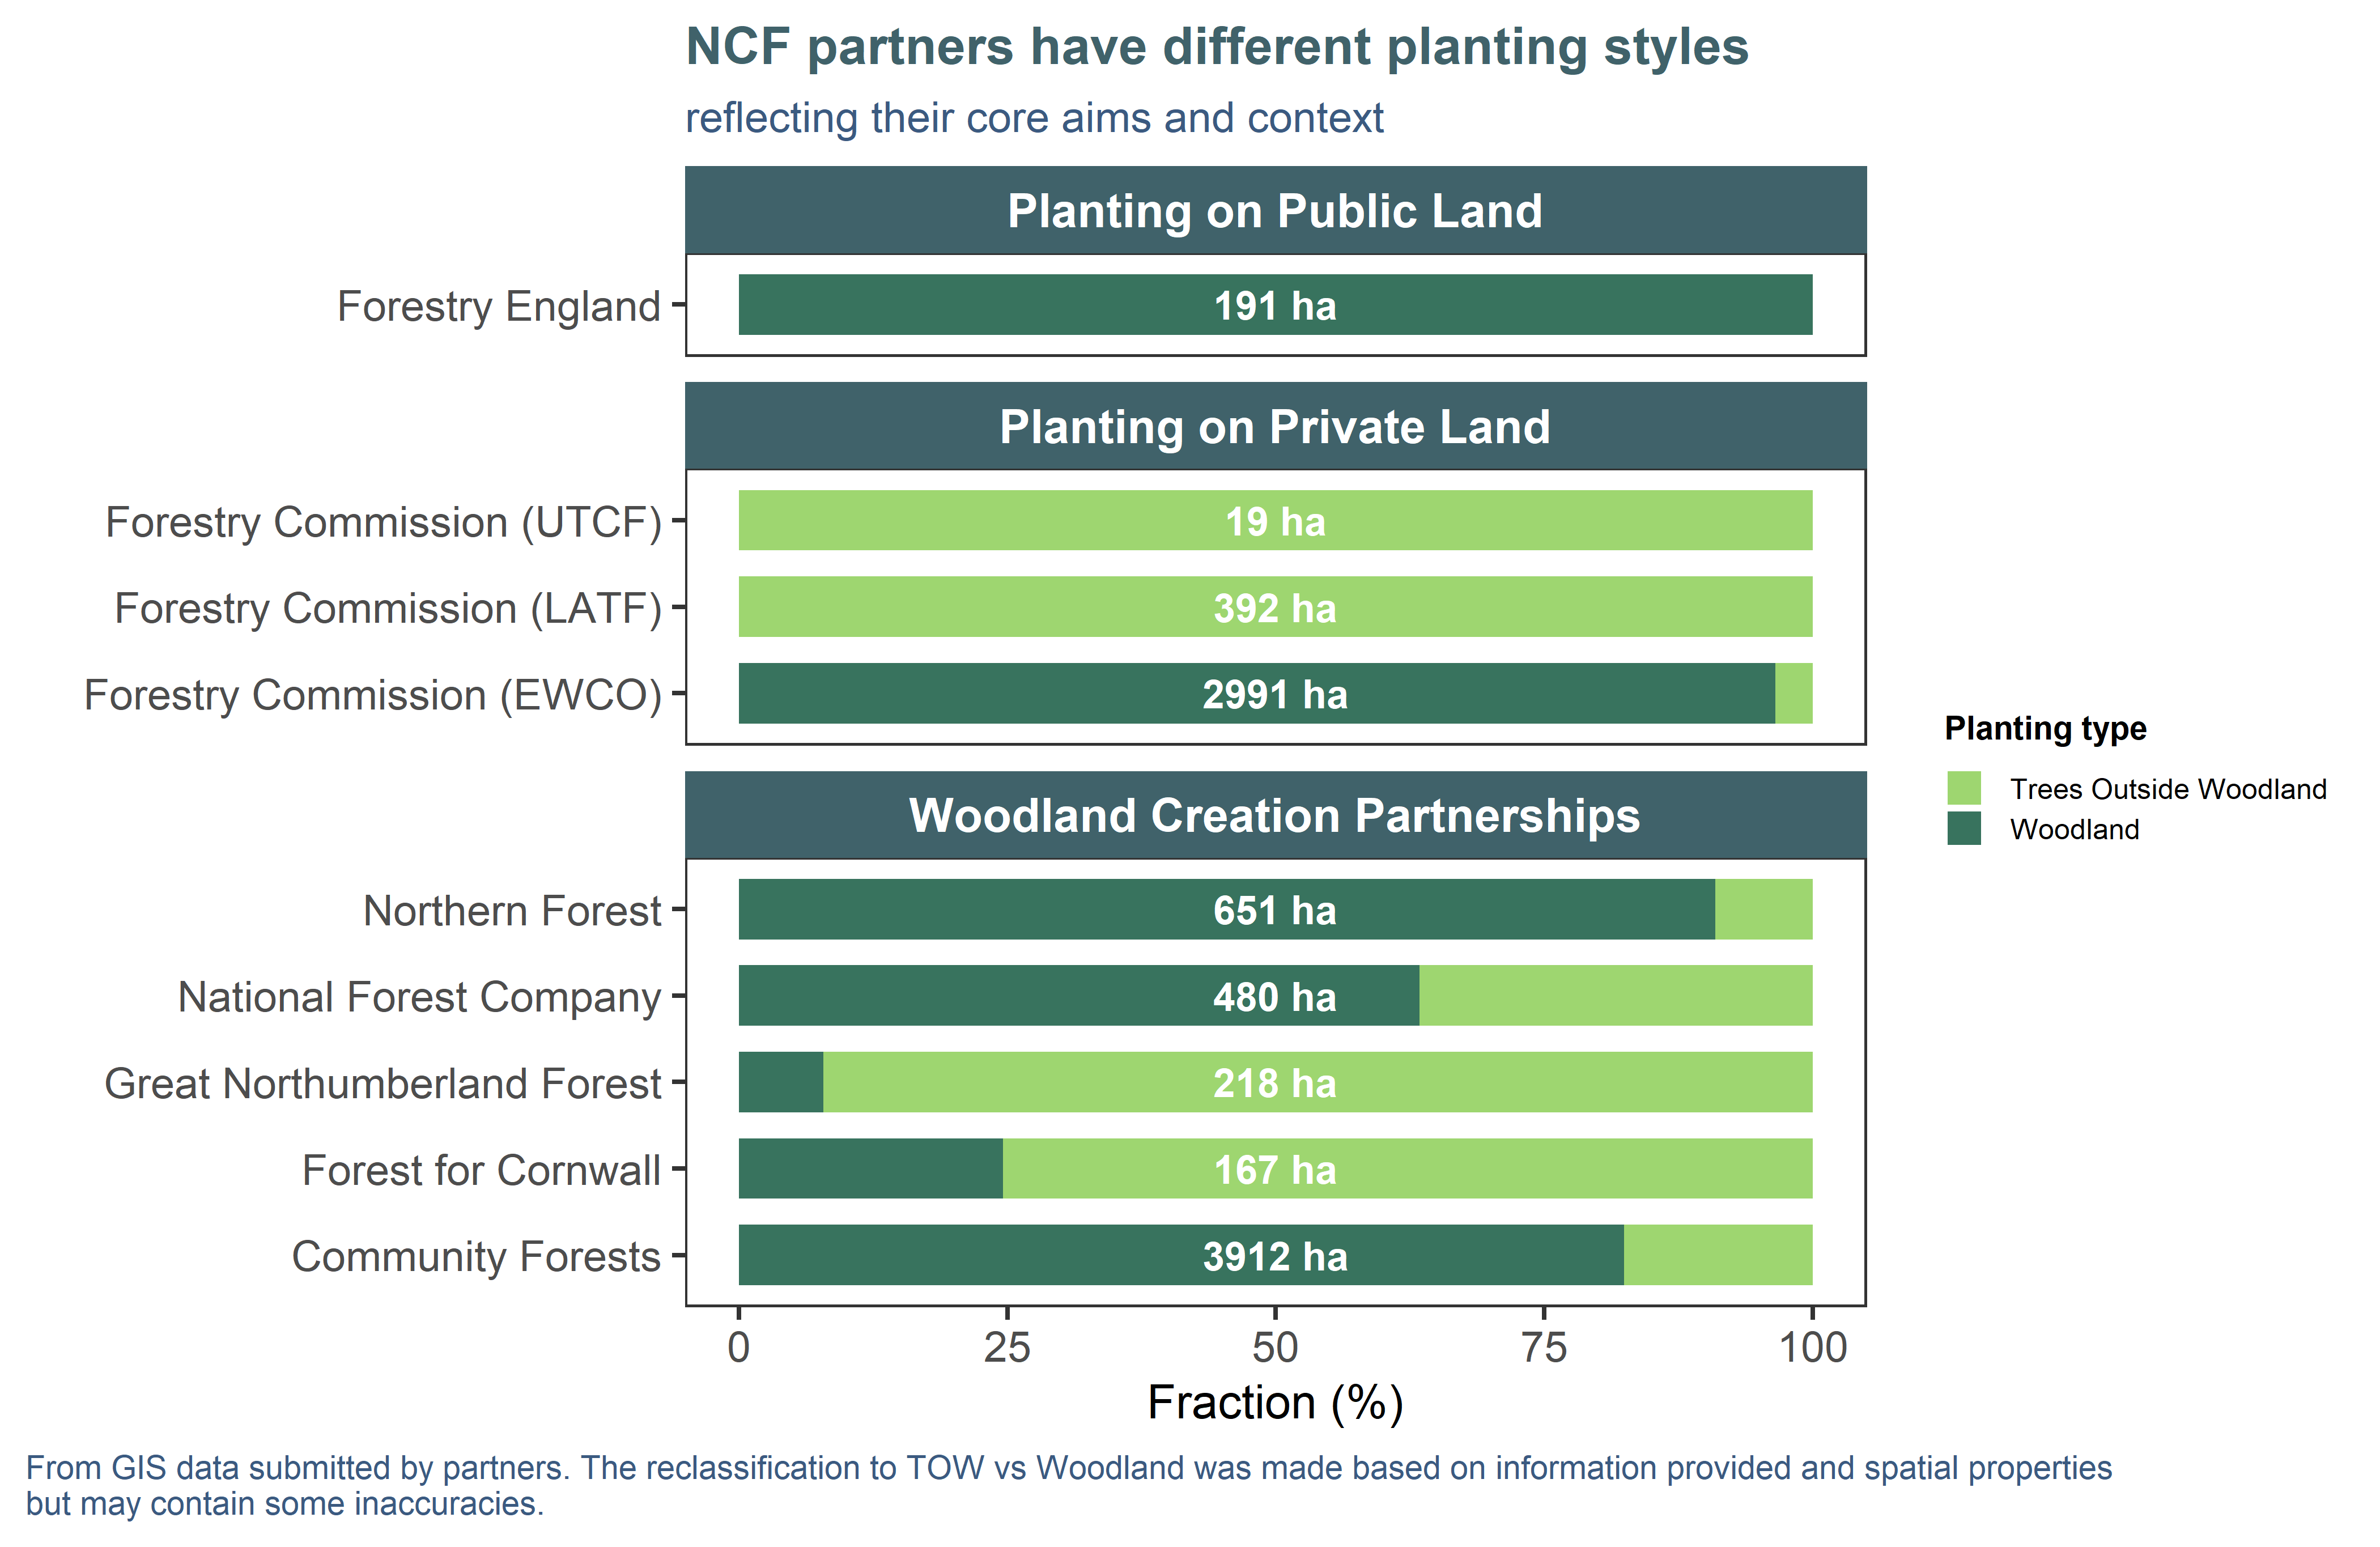
Figure 2.2: Different NCF partners planted varying proportions of woodland vs trees outside woodland. Hectares shown on the bar plot are calculated areas from the GIS planting masterfile and represent total planting for that partner.
2.2 Prior land use
NCF sites were predominantly planted on agricultural (62%) land (Figure 2.3), semi-natural grassland (17%), as well as greenspaces and urban sites (11%).
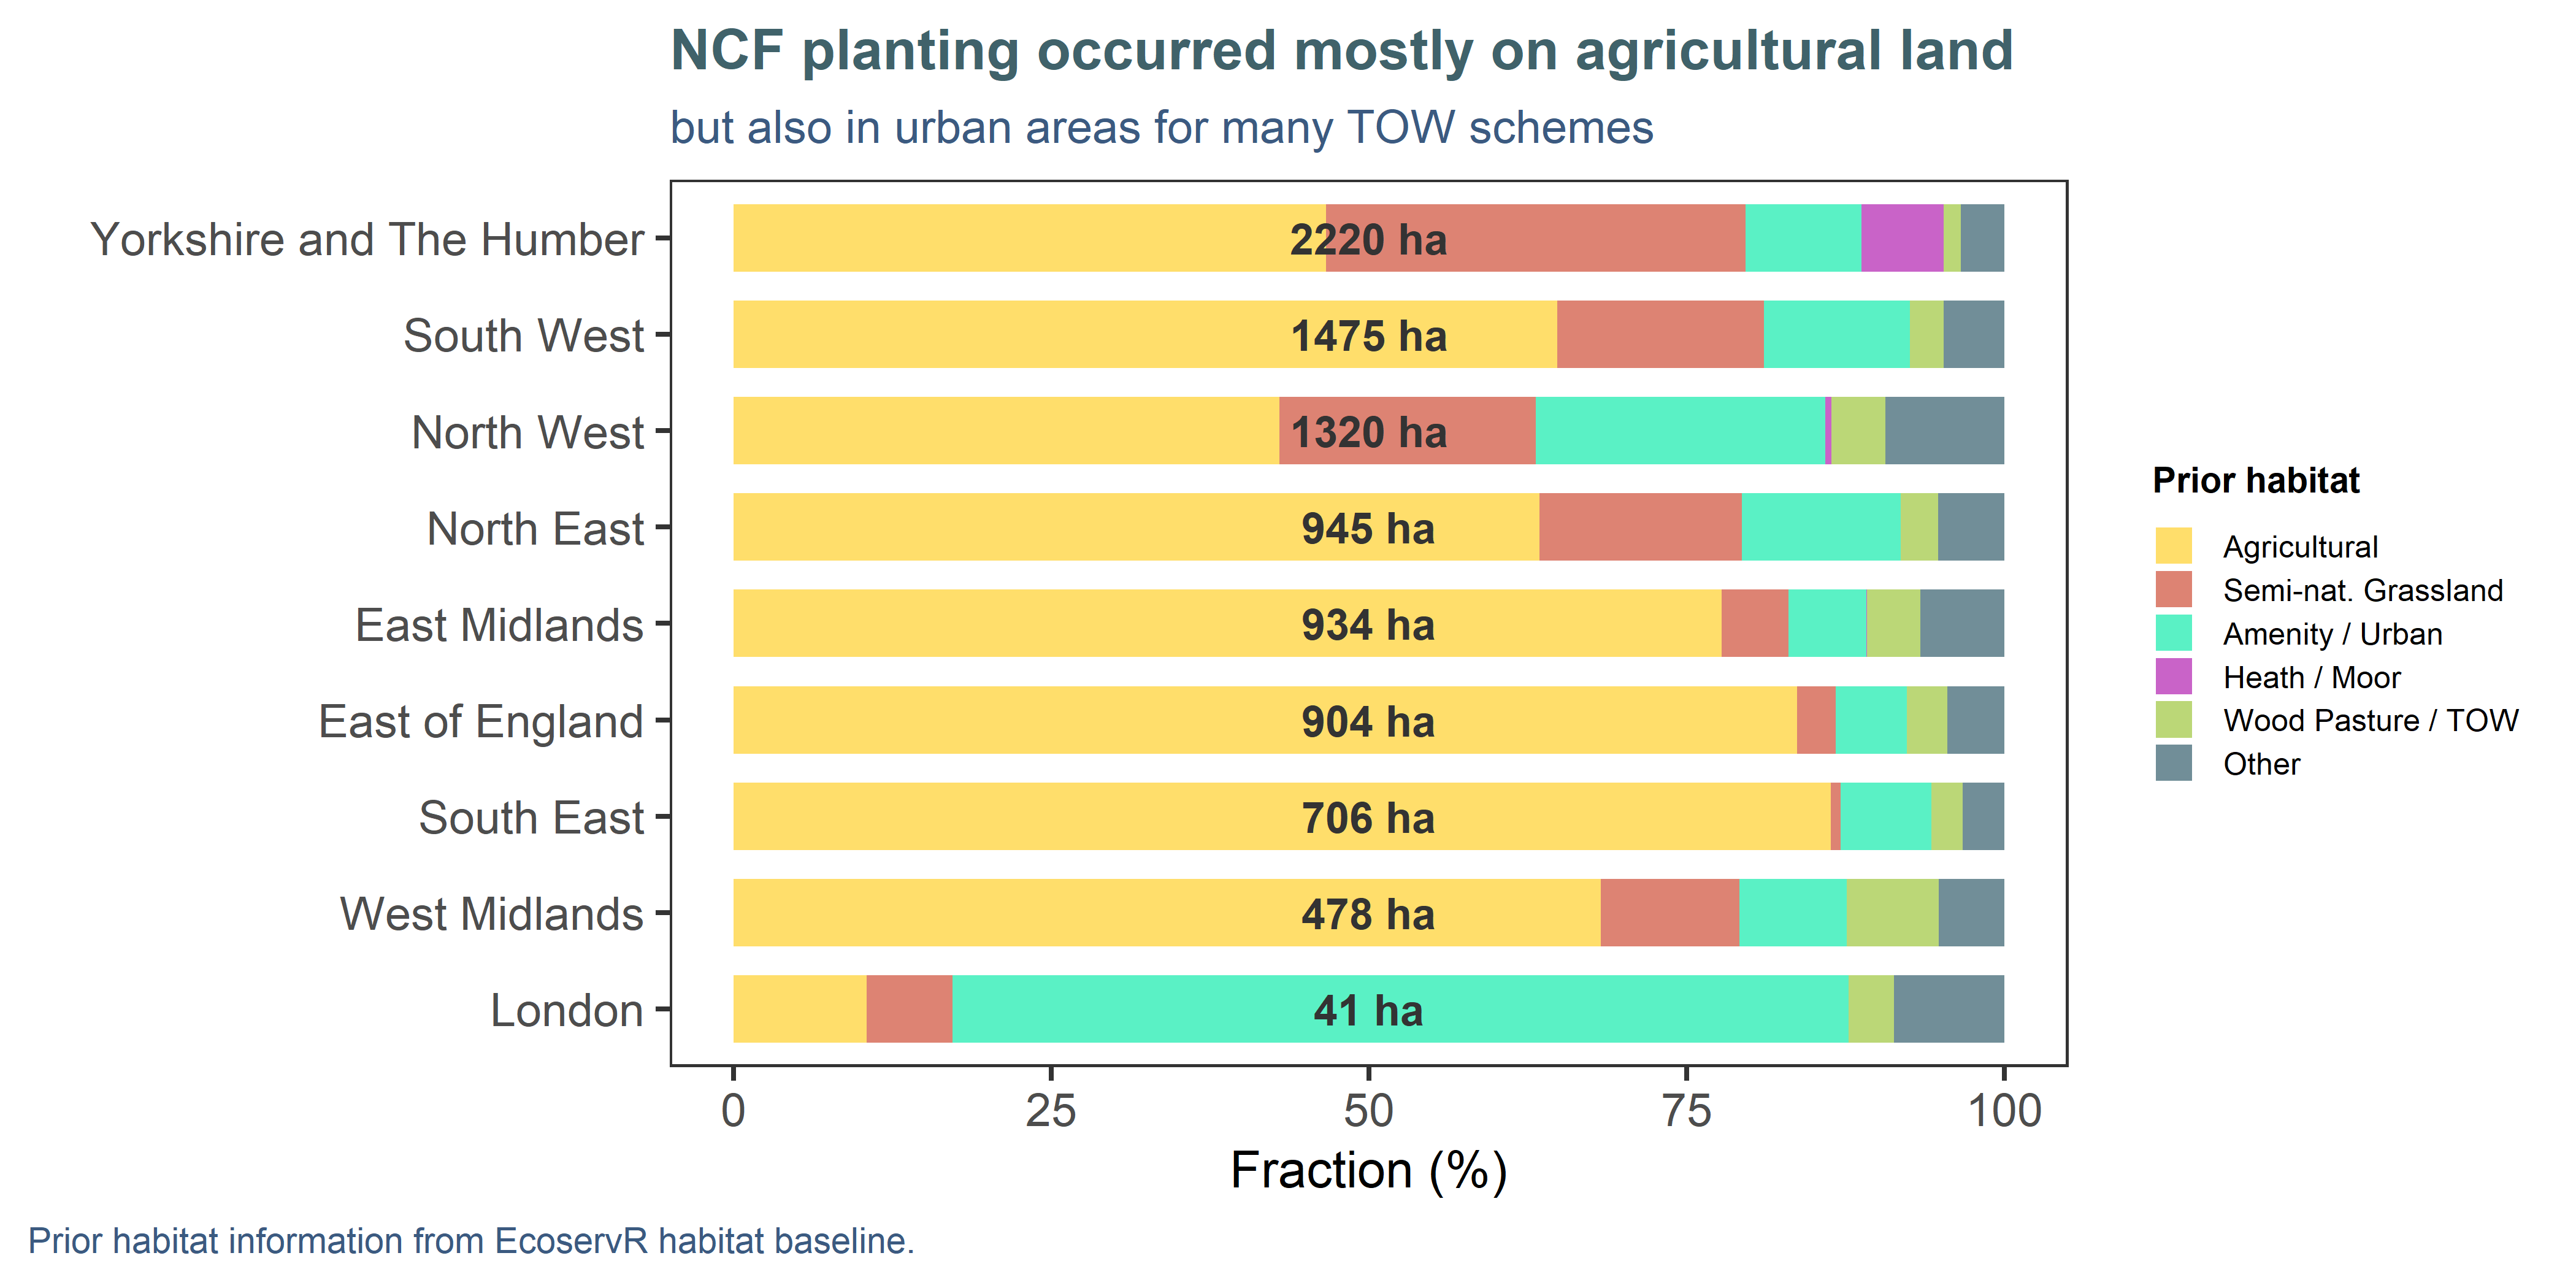
Figure 2.3: Previous habitats at planting locations were inferred from the habitat baseline generated for this project, which contain information from a wide range of environmental spatial layers (see Appendix A). The ‘Other’ category contains less frequent habitats like marshy grassland and bracken, and a small proportion of artefacts from imprecisely drawn site boundaries, such as overlaps with existing woodland or bodies of water. Hectares shown on the plot are calculated areas from the GIS planting masterfile and represent total planting for that region.
2.3 Spatial context: sensitivities and opportunities
Having a spatial record of where woodland creation is occurring allowed us to generate summaries of planting against contextual datasets to assess where NCF may be preferentially providing benefits in areas of need, or indicate where schemes may have been particularly challenging to implement due to constraints. It is important to note that the layers used in Figure 2.4 are of coarser resolution than our site-level mapping and therefore, these comparisons are indicative only.
Woodland creations schemes usually avoid planting on the most productive agricultural land, and accordingly, 91% of NCF planting falls on land with medium-low (or no) agricultural capabilities (Grades 3+ of the Agricultural Land Classification; Figure 2.4A). Even when sites occur within a certain ALC grade, it does not signify they are located on productive farmland (or took land out of agricultural use): the ALC assigns a grade to any land capable of supporting agriculture, regardless of the current land use.
An apparently high proportion of planting (31%) falls in areas marked as “high sensitivity” to woodland creation by the Forestry Commission’s sensitivity maps (version 4.0 variant 1; Figure 2.4B). These maps use a range of nationally available data to facilitate spatial prioritisation and help identify suitable areas for woodland creation (Forestry Commission 2024a). However, it does not automatically follow that a scheme in a low-risk area will be approved, or that a scheme in a high-risk area cannot go forward. A high-sensitivity designation may reflect the potential presence of peat, wading birds, or other constraints, which typically need to be confirmed at the site level via an environmental impact assessment. Most of the North of England falls under medium and high sensitivity, so it is not surprising that partners who operate there (e.g. Community Forests, Northern Forest) are planting within these classes. In the context of NCF, the classification can be seen as a measure of effort it likely took to get the site approved and planted. It is important to note that the layer targets woodland creation and is restricted to “soft” land covers: the 10% of NCF planting in the “Unsuitable” category mainly reflects trees outside woodland in urban areas.
We assessed planting locations against the Tree Equity Score map (American Forests and Centre for Sustainable Healthcare 2024) which sets canopy cover targets to help prioritise planting where tree cover is low. Around 31% of the planting within TES mapped areas falls within the high and highest priority ranking (Figure 2.4C). However, as the TES is restricted to urban and peri-urban areas, we also contrasted the planting against the Index of Multiple Deprivation (Ministry of Housing, Communities & Local Government 2019), which has England-wide coverage. There have been 564 ha planted within areas in the top 20% most deprived areas of the country (Figure 2.4D), chiefly by the Community Forests in the North.
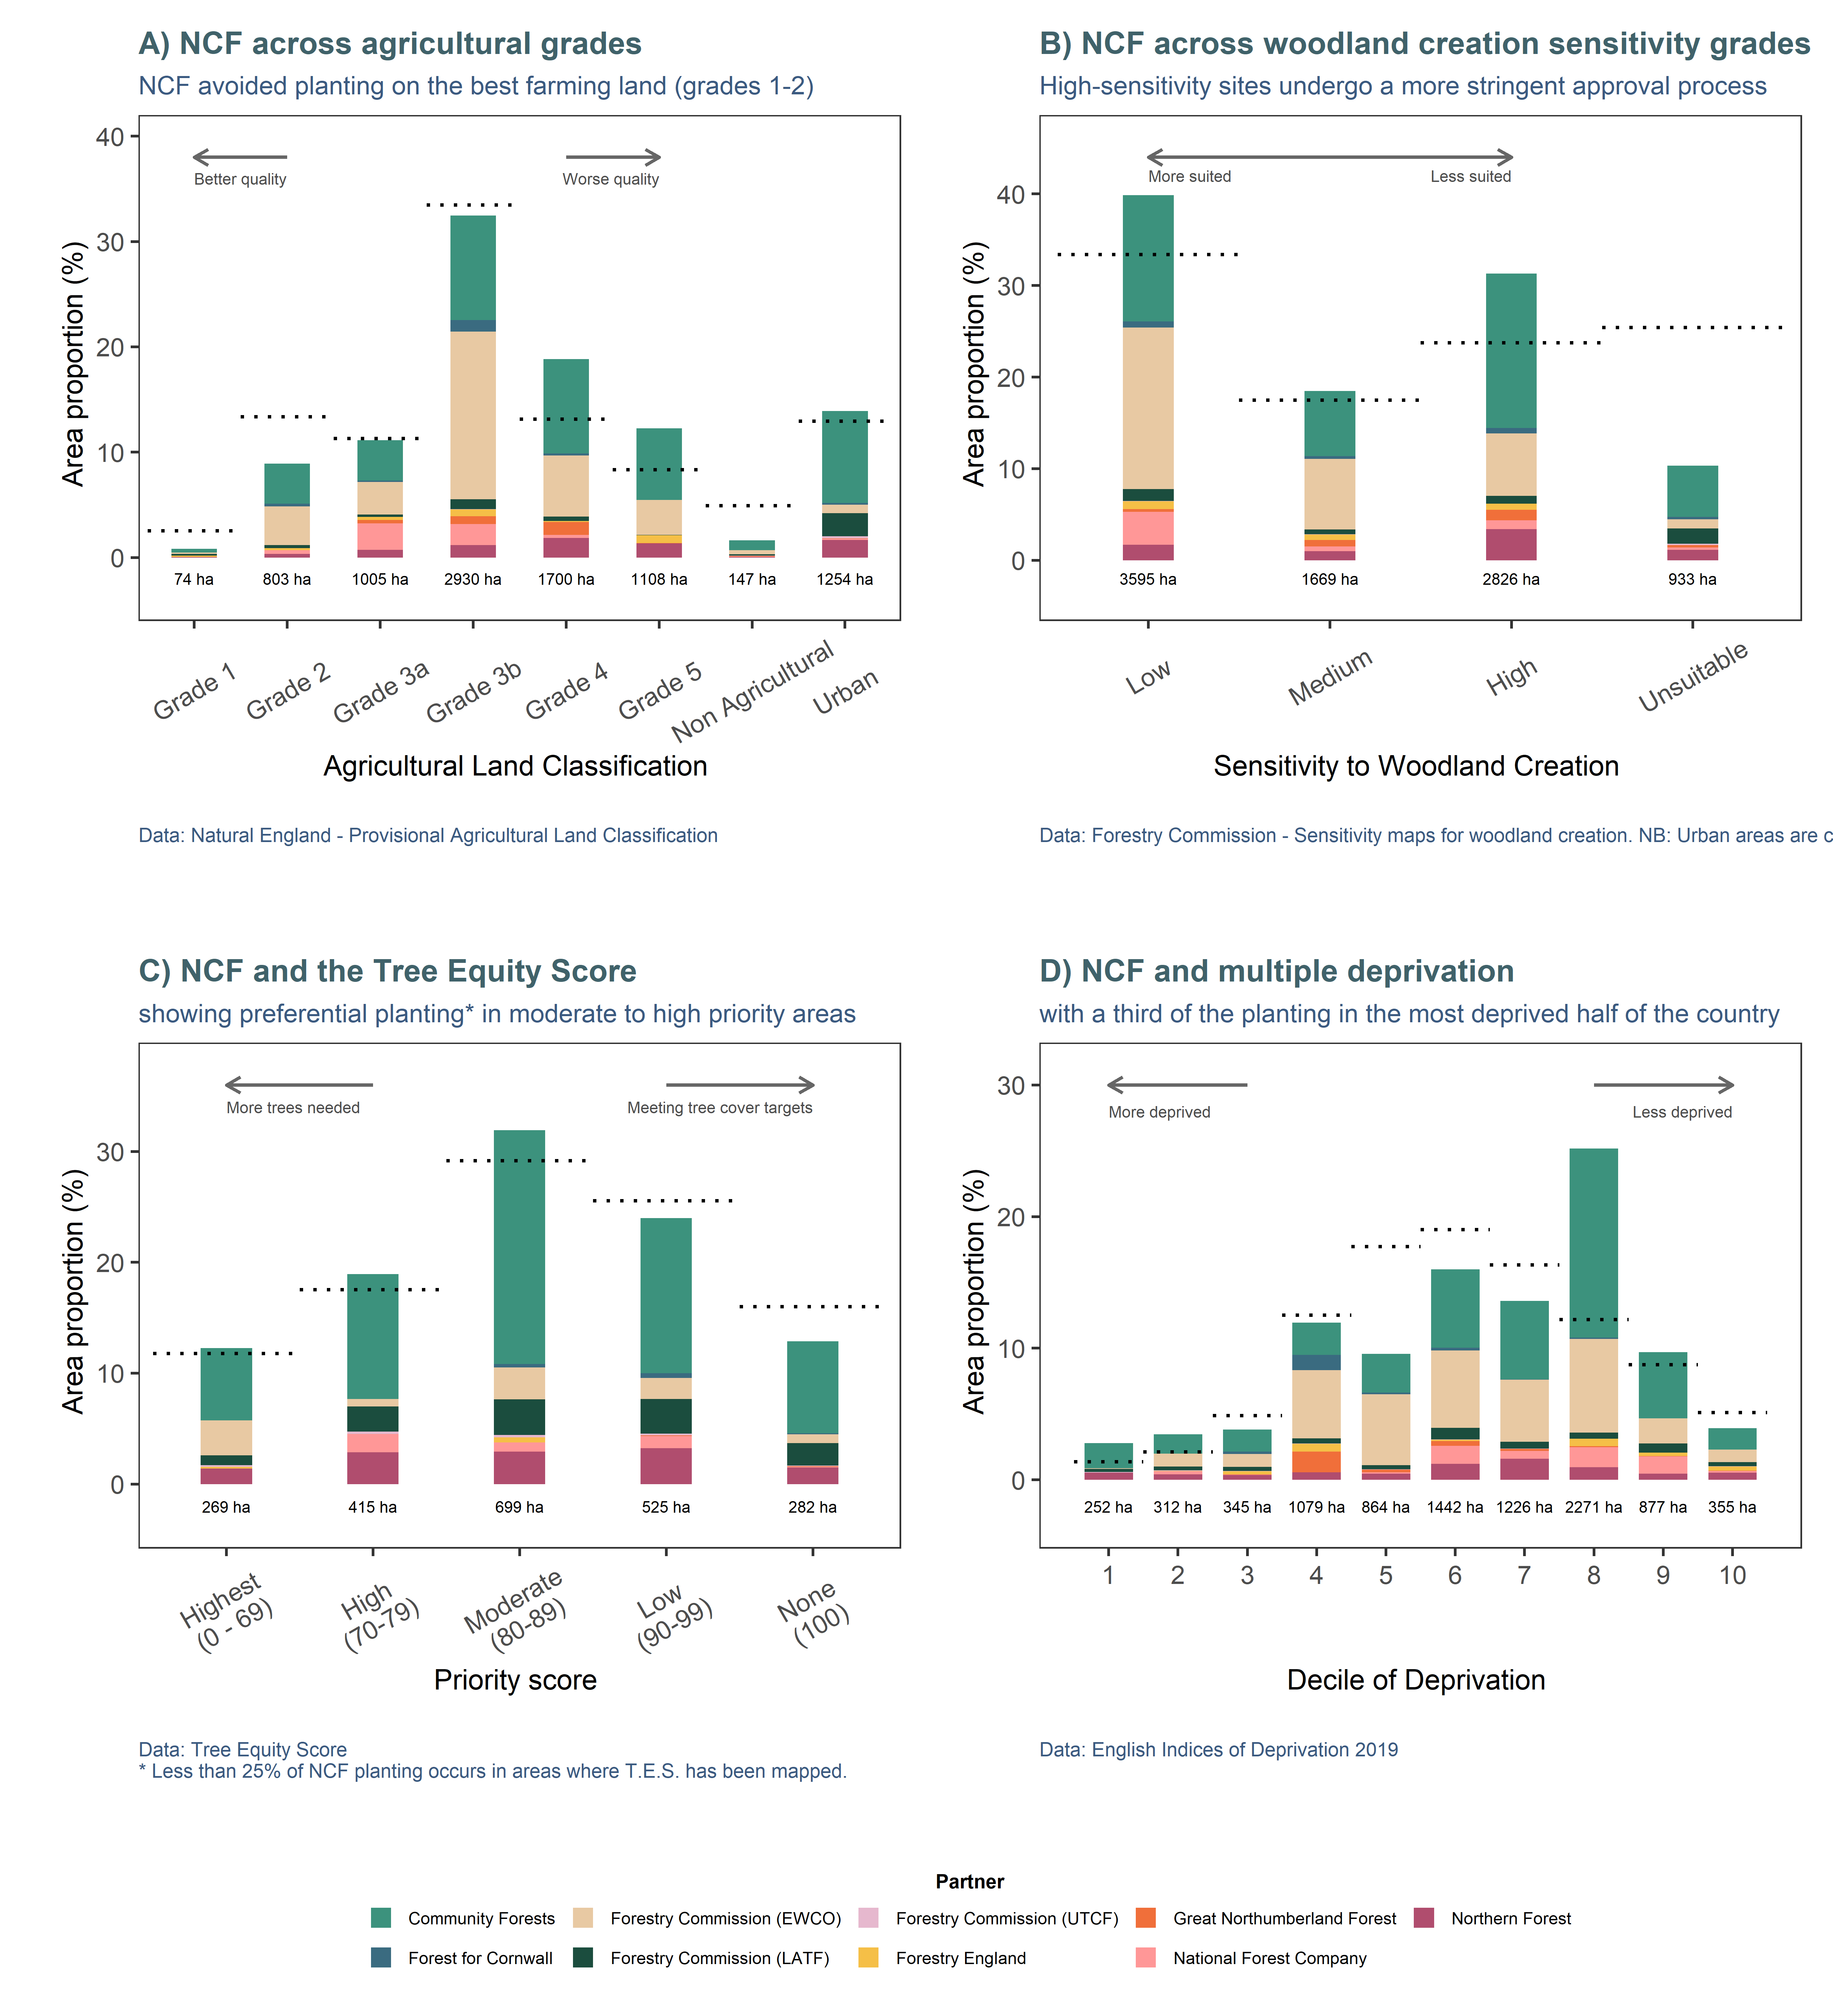
Figure 2.4: Spatial assessment of NCF planting against sensitivities to woodland creation and socio-economic markers. The bars indicate the proportions and total hectares planted in each category, while the dotted line indicate the expected proportions based on the proportions of the classes themselves in the national dataset.
While it is interesting to explore patterns in these breakdowns at the evaluation stage, the real strength of a spatial approach is to facilitate planning and prioritisation of future schemes. Candidate locations could be screened systematically for red flags (sensitivities) and aligned with key priorities (opportunities). Some of the intermediary datasets and methods produced for this project (e.g. automatic yield class extraction for Carbon Sequestration, nutrient export by catchment for Water Quality) could help develop opportunity and constraint maps to identify suitable places for woodland creation, with added potential to deliver multiple benefits for people and nature.
2.4 Planting data collection
As no consolidated spatial file was available to represent all planting conducted under the Nature for Climate banner, we reached out to all programme partners to request spatial data (ideally polygons representing planted areas) and return forms containing official site-level information such as declared area, number of trees planted, planting type, etc. These data exhibited strong variations in terms of format, digitising standards and completeness, making the generation of the masterfile for analysis the most challenging part of the project.
In simplified terms, the process consisted of:
- reviewing data submissions for accuracy (correct spatial reference, showing in right location on the map)
- where no polygons were available, generating spatial information from grid references
- matching spatial data to return form information (official statistics and detailed scheme information are not routinely kept in GIS files)
- harmonising attributes among partners
- merging all data together
- encoding habitat types for modelling based on provided information (broadleaf vs conifer, TOW vs woodland)
- cleaning up the file to erase obvious non-planted areas (e.g. buildings included in planting footprint, bodies of water)
This exercise brought to light several issues in terms of data management inconsistencies, detailed in Appendix B alongside some recommendations. While the planting masterfile is not perfectly complete or accurate, we are confident that it captures the breadth of the NCF programme, with all partners and workstreams represented to a good standard. There was sufficient detail in the locations, extents and types of planting to inform the indicators, and accordingly we were able to identify spatial variation in the effectiveness of schemes to deliver benefits.
2.5 Habitat baseline
All indicators rely on a land cover map to measure pre- and post-planting benefits. For this project, we used the EcoservR toolkit4 to develop a habitat baseline for all of England. This map is based on the OS MasterMap Topography framework, and as such is much more thematically and spatially detailed than simpler land cover maps typically used in natural capital assessments (see Appendix A for details).
References
We are the developers of EcoservR, an open-source R package for mapping and measuring natural capital assets and outcomes.↩︎