Tree Planting Scientific Indicators
Evaluation of the Nature for Climate Programme
10-08-2026
Executive summary
About
The Nature for Climate Fund (NCF) tree programme is a government initiative, supported by Defra, aimed at tackling climate change and improving nature by increasing tree canopy cover in England. To support understanding of the long-term environmental outcomes of the programme, Defra commissioned LJMU to develop a series of indicators across five key areas: carbon sequestration, biodiversity, air quality, flood mitigation and water quality. NCF also aims to generate social and economic uplift through woodland creation. In this updated version of the report (2026), we have included metrics around access to nature, and produced an indicative economic valuation of all benefits to support the wider evaluation of the programme.
We developed a suite of indicators that can be scaled from site- to programme-level and which reflect, where possible, the influence that the spatial configuration and context of a planting scheme has on its environmental outcomes. For instance, the carbon indicator makes use of yield class and soil predictions at the planting location. Ecological network modelling (biodiversity indicator) and the access to nature distance metric are highly sensitive to landscape configuration (existing woodland and household locations, respectively). We used local-authority-level pollution removal rates for the air quality indicator, and catchment-level nutrient loadings for water quality. The water storage metric is restricted to national rates due to data availability. This spatial focus allows us to unpick where the programme has delivered the “right trees in the right places”, and brings to light regional differences in benefits provided by trees. These indicators have been applied to all planting conducted between 2020 and 2025 under the Planting on Public Land, Planting on Private Land, and Woodland Creation Partnerships workstreams.
The planting data collected for this project amounts to 7,594 individual planting sites, covering 14,533 ha of declared planting (approx. 20 million trees) across 269 local authorities. This is the most complete spatial view of Nature for Climate planting gathered to date.
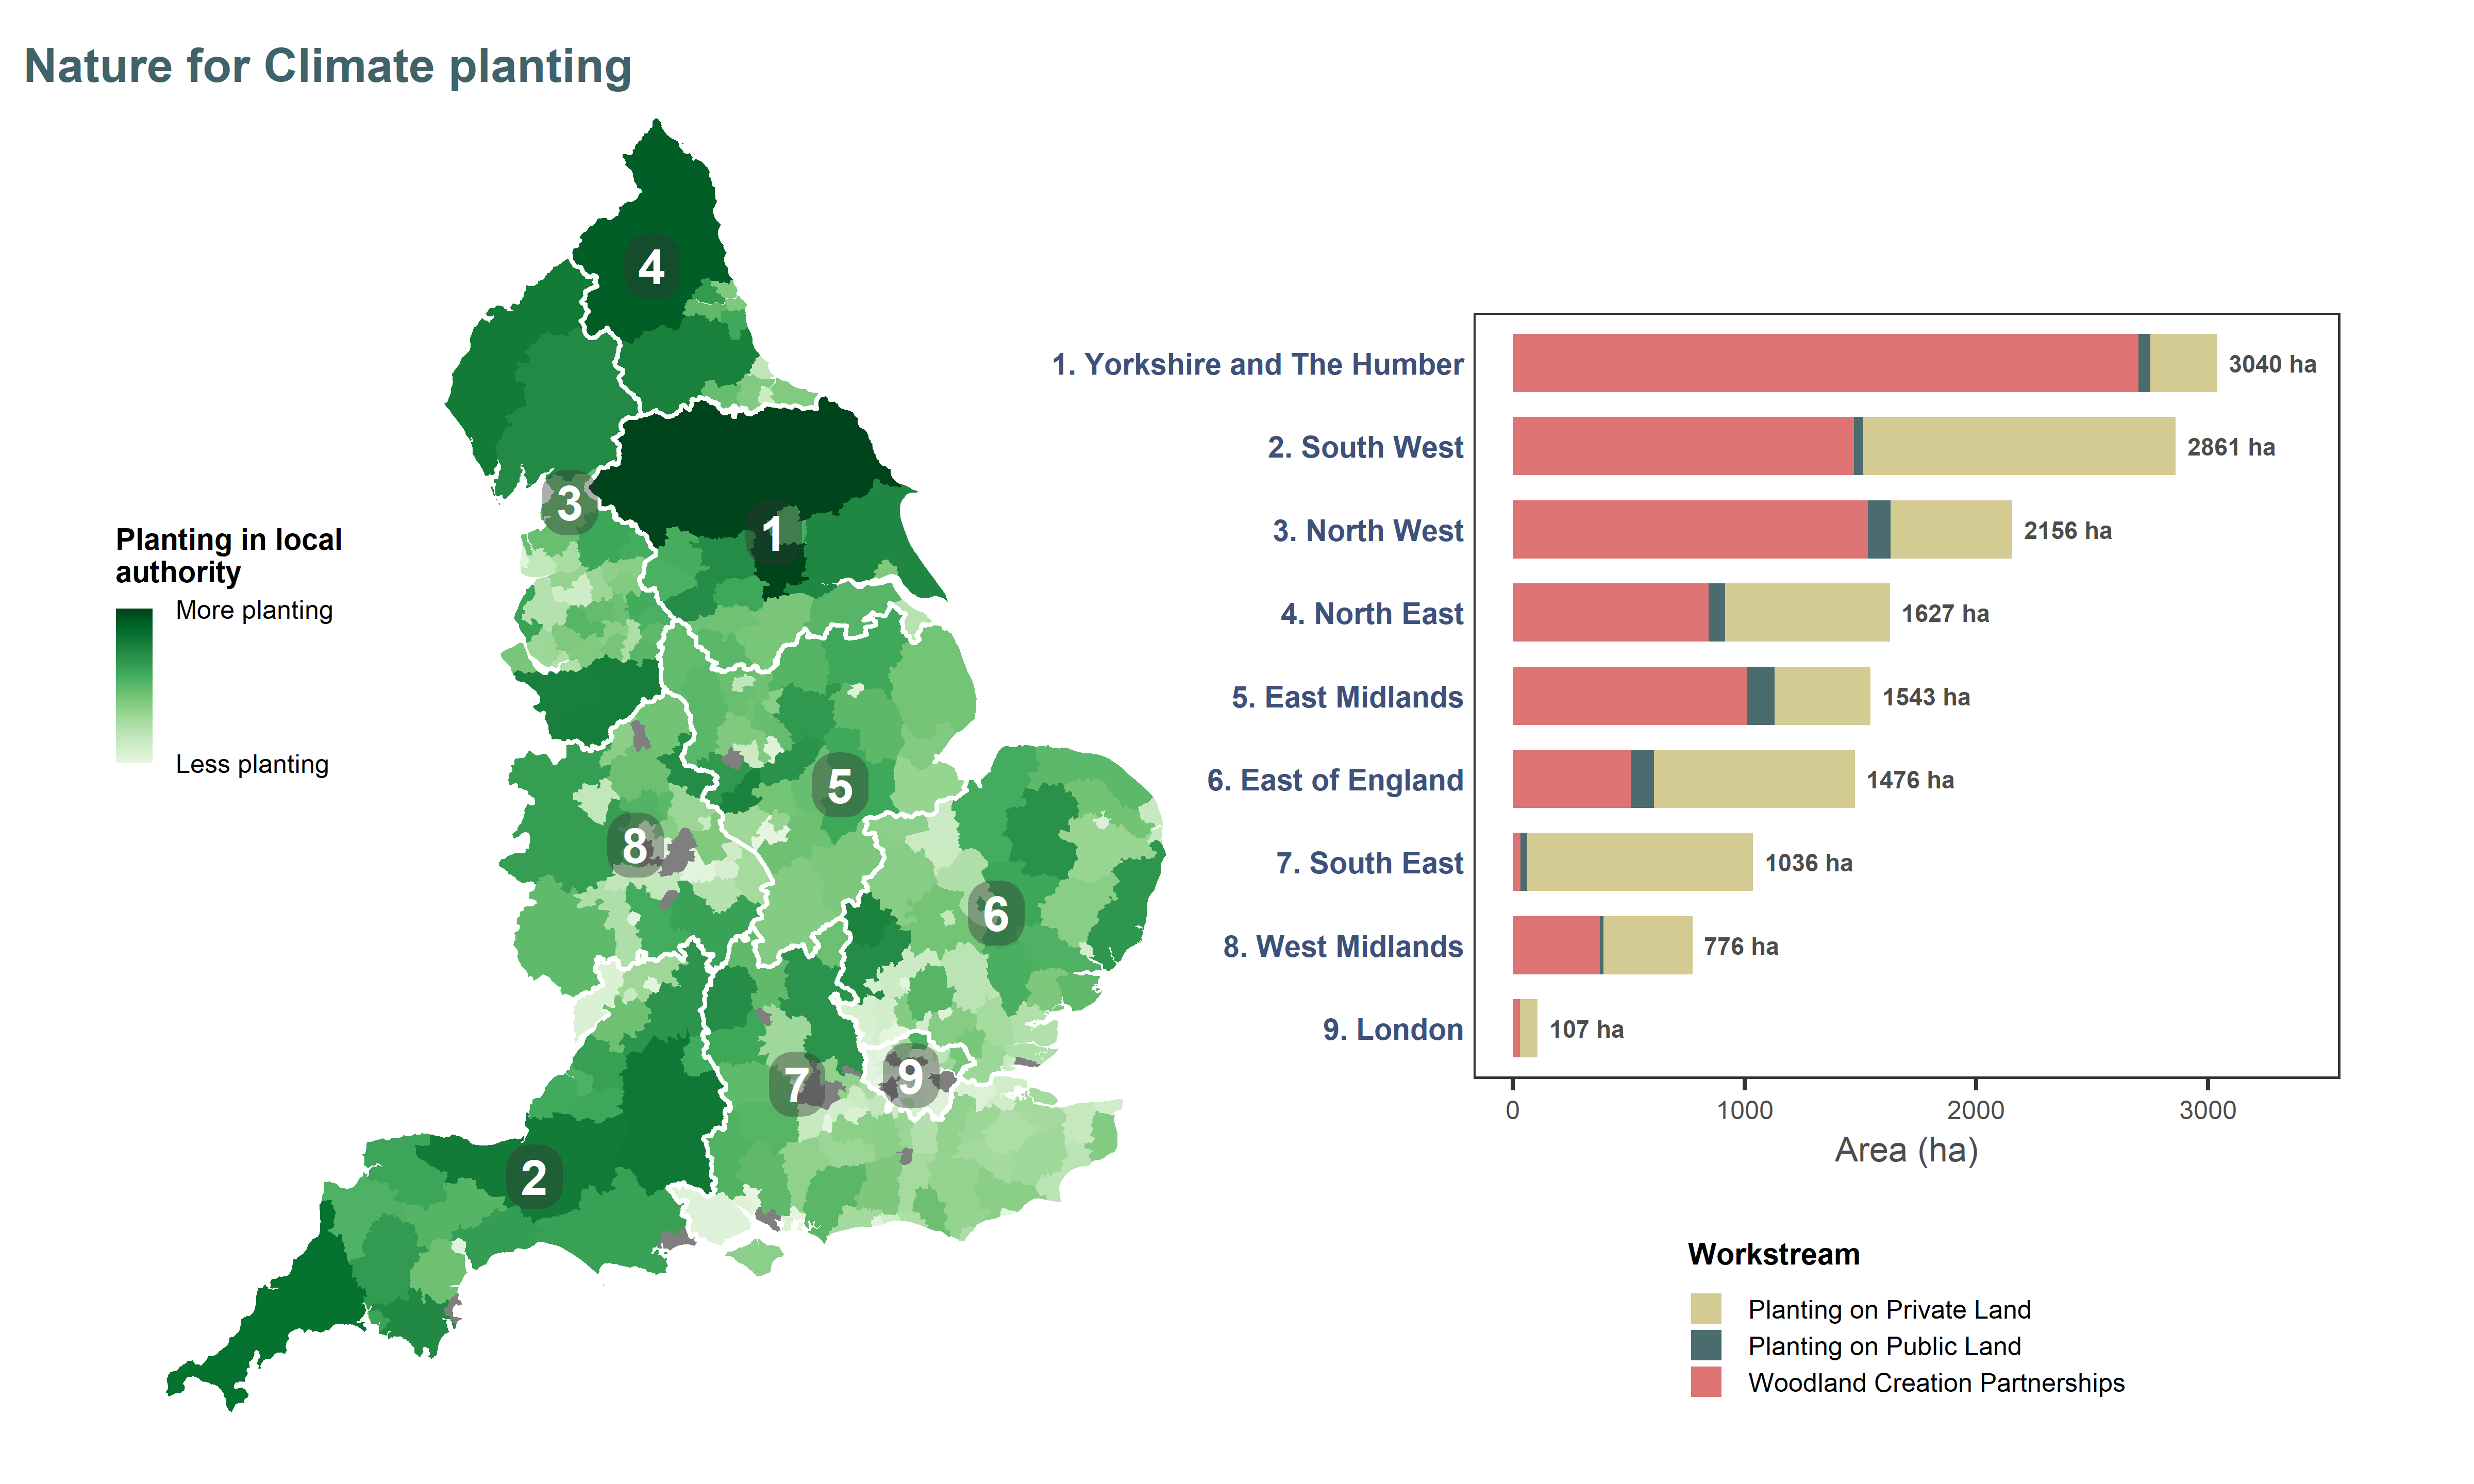
Figure ES1. Overview of NCF planting across England. Darker areas indicate local authorities (LAs) where there was more NCF-funded woodland creation (log scale for better visualisation; LAs without planting are shown in grey). Regions are ordered top-down from greatest to smallest amount of planting. Hectares shown on the bar plot are calculated areas from the GIS planting masterfile.
Key benefits
The NCF planting could deliver, compared to the prior land use it replaced, the following benefits by 2050:
- the sequestration of an additional 2.2 to 2.4 million tonnes of CO2
- an expansion of ecological networks between 13,620 and 24,692 hectares for woodland species
- the annual removal of an extra 454 - 519 tonnes of airborne pollutants
- the annual storage of an extra 4.6 Mm3 (millions of cubic meters) of water, contributing to flood regulation
- the annual removal of 358 tonnes of nitrogen and 6.7 tonnes of phosphorus to improve water quality
- improved access for up to 2,000 households previously deprived of green spaces within a 15-minute walk (and ca. 102,200 households gaining access to woodland), with up to 16.6m annual visits
It is important to note that these are projected potential benefits, conditional on the sites being maintained and managed appropriately. Trees may experience damage or mortality, reducing the magnitude of the realised benefits.
This report provides headline figures of the benefits provided by NCF planting, and regional breakdowns to show how variables benefits may be across England. The data behind these results is highly granular, and a companion data portal has been created to allow interactive exploration of the results in more detail (e.g. by partner, by local authority).
Economic value
An economic valuation exercise provided an indication of the potential outcomes of NCF planting in monetary terms. Valuations were conducted using evidence sources recommended by the Enabling a Natural Capital Approach service databook (DEFRA 2025b). This valuation sits within a natural capital framework, allowing services that may otherwise be perceived as intangible to be considered alongside more material factors in policy and decision-making. The resulting values (Table 1) should be interpreted with caution, as they provide an indication of the order of magnitude (ballpark) of benefits, rather than precise estimates of the services. These values can support an assessment of value for money, and help recognise the importance of the services that woodland provides to society.
Valuation was conducted, where possible, for the period 2021-2050 (Chapter 9), except for the figures in red in Table 1 which could only be calculated for a 100-year period. We also provided a valuation for a 50-year period (2021-2070; see Appendix D) to support the evaluation of social returns on investment for the programme. We calculated average annual values (expressed in 2026 terms) and asset values (total value of all future benefits over the period). Annual and asset values include discounting over time to account for the fact that benefits received in the future are generally valued less than those received today.
Table 1. Indicative economic value of benefits generated by NCF planting for the period 2021-2050. Annual values represent the average (discounted) value of the service expected to be delivered by the growing trees in their first 30 years. The asset value, expressed as a net present value, represents the total value of the service by the end of the period. NB: air quality values (in red) can only be reported for a 100-y period due to methodological differences, and the annual value does not include time preference (discounting). Values are reported in constant 2026 prices, and ranges reflect valuation uncertainty. When a range was not available, we present the figure as a central estimate.
| Annual value (£m/y) | Asset value (£m) | ||||
|---|---|---|---|---|---|---|
Indicator | low | mid | high | low | mid | high |
Carbon sequestration | 15.86 | 16.81 | 18.09 | 475.83 | 504.30 | 542.77 |
Biodiversity | 11.08 | 12.67 | 14.25 | 361.83 | 413.52 | 465.21 |
Air quality | 10.56 | 11.19 | 11.82 | 530.46 | 562.37 | 594.27 |
Flood mitigation | 1.08 | 21.56 | ||||
Water quality | 0.55 | 0.75 | 0.96 | 16.53 | 22.59 | 28.65 |
Recreation | 31.36 | 940.91 | ||||
Regional effectiveness of planting
NCF planting is widely but not evenly dispersed across England, with the majority of the planting concentrated in the North. Therefore, reporting benefits only in absolute terms does not allow the exploration of spatial patterns in the delivery of benefits, as they are simply correlated with the amount of planting. We therefore produced effectiveness metrics for all indicators, defined as the amount of benefits per hectare of planting. The collapsible sections below present a view of those metrics with spatial variability at the local authority level (maps; with data transformations to increase contrast) and average regional effectiveness (bar charts). Regions are ordered vertically from greatest to least amount of planting, and annotated with their ranking (1 = most effective, 9 = least effective).
Effectiveness values provide insight into where NCF planting is especially suited to delivering certain benefits. Note that variations in effectiveness are not a reflection on scheme design or quality, or of different levels of “effort” in tackling issues among regions. Rather, these differences are driven by regional conditions and properties such as climate, soils, dominant land use, pollution levels, etc. The data portal that acts as a companion to this report allows to explore results interactively.
Carbon Sequestration
Carbon capture by trees depends on the interaction of species, climate, soils and management at any given location. The effectiveness of NCF sites to capture carbon dioxide is projected to be highest in the North West, a region where yield class (a measure of tree productivity) is predicted to increase significantly for many species under climate change scenarios. (For this analysis, we assumed a standard mix of common species as site-level species data was not available, and modelled results for different spacing and management scenarios.)
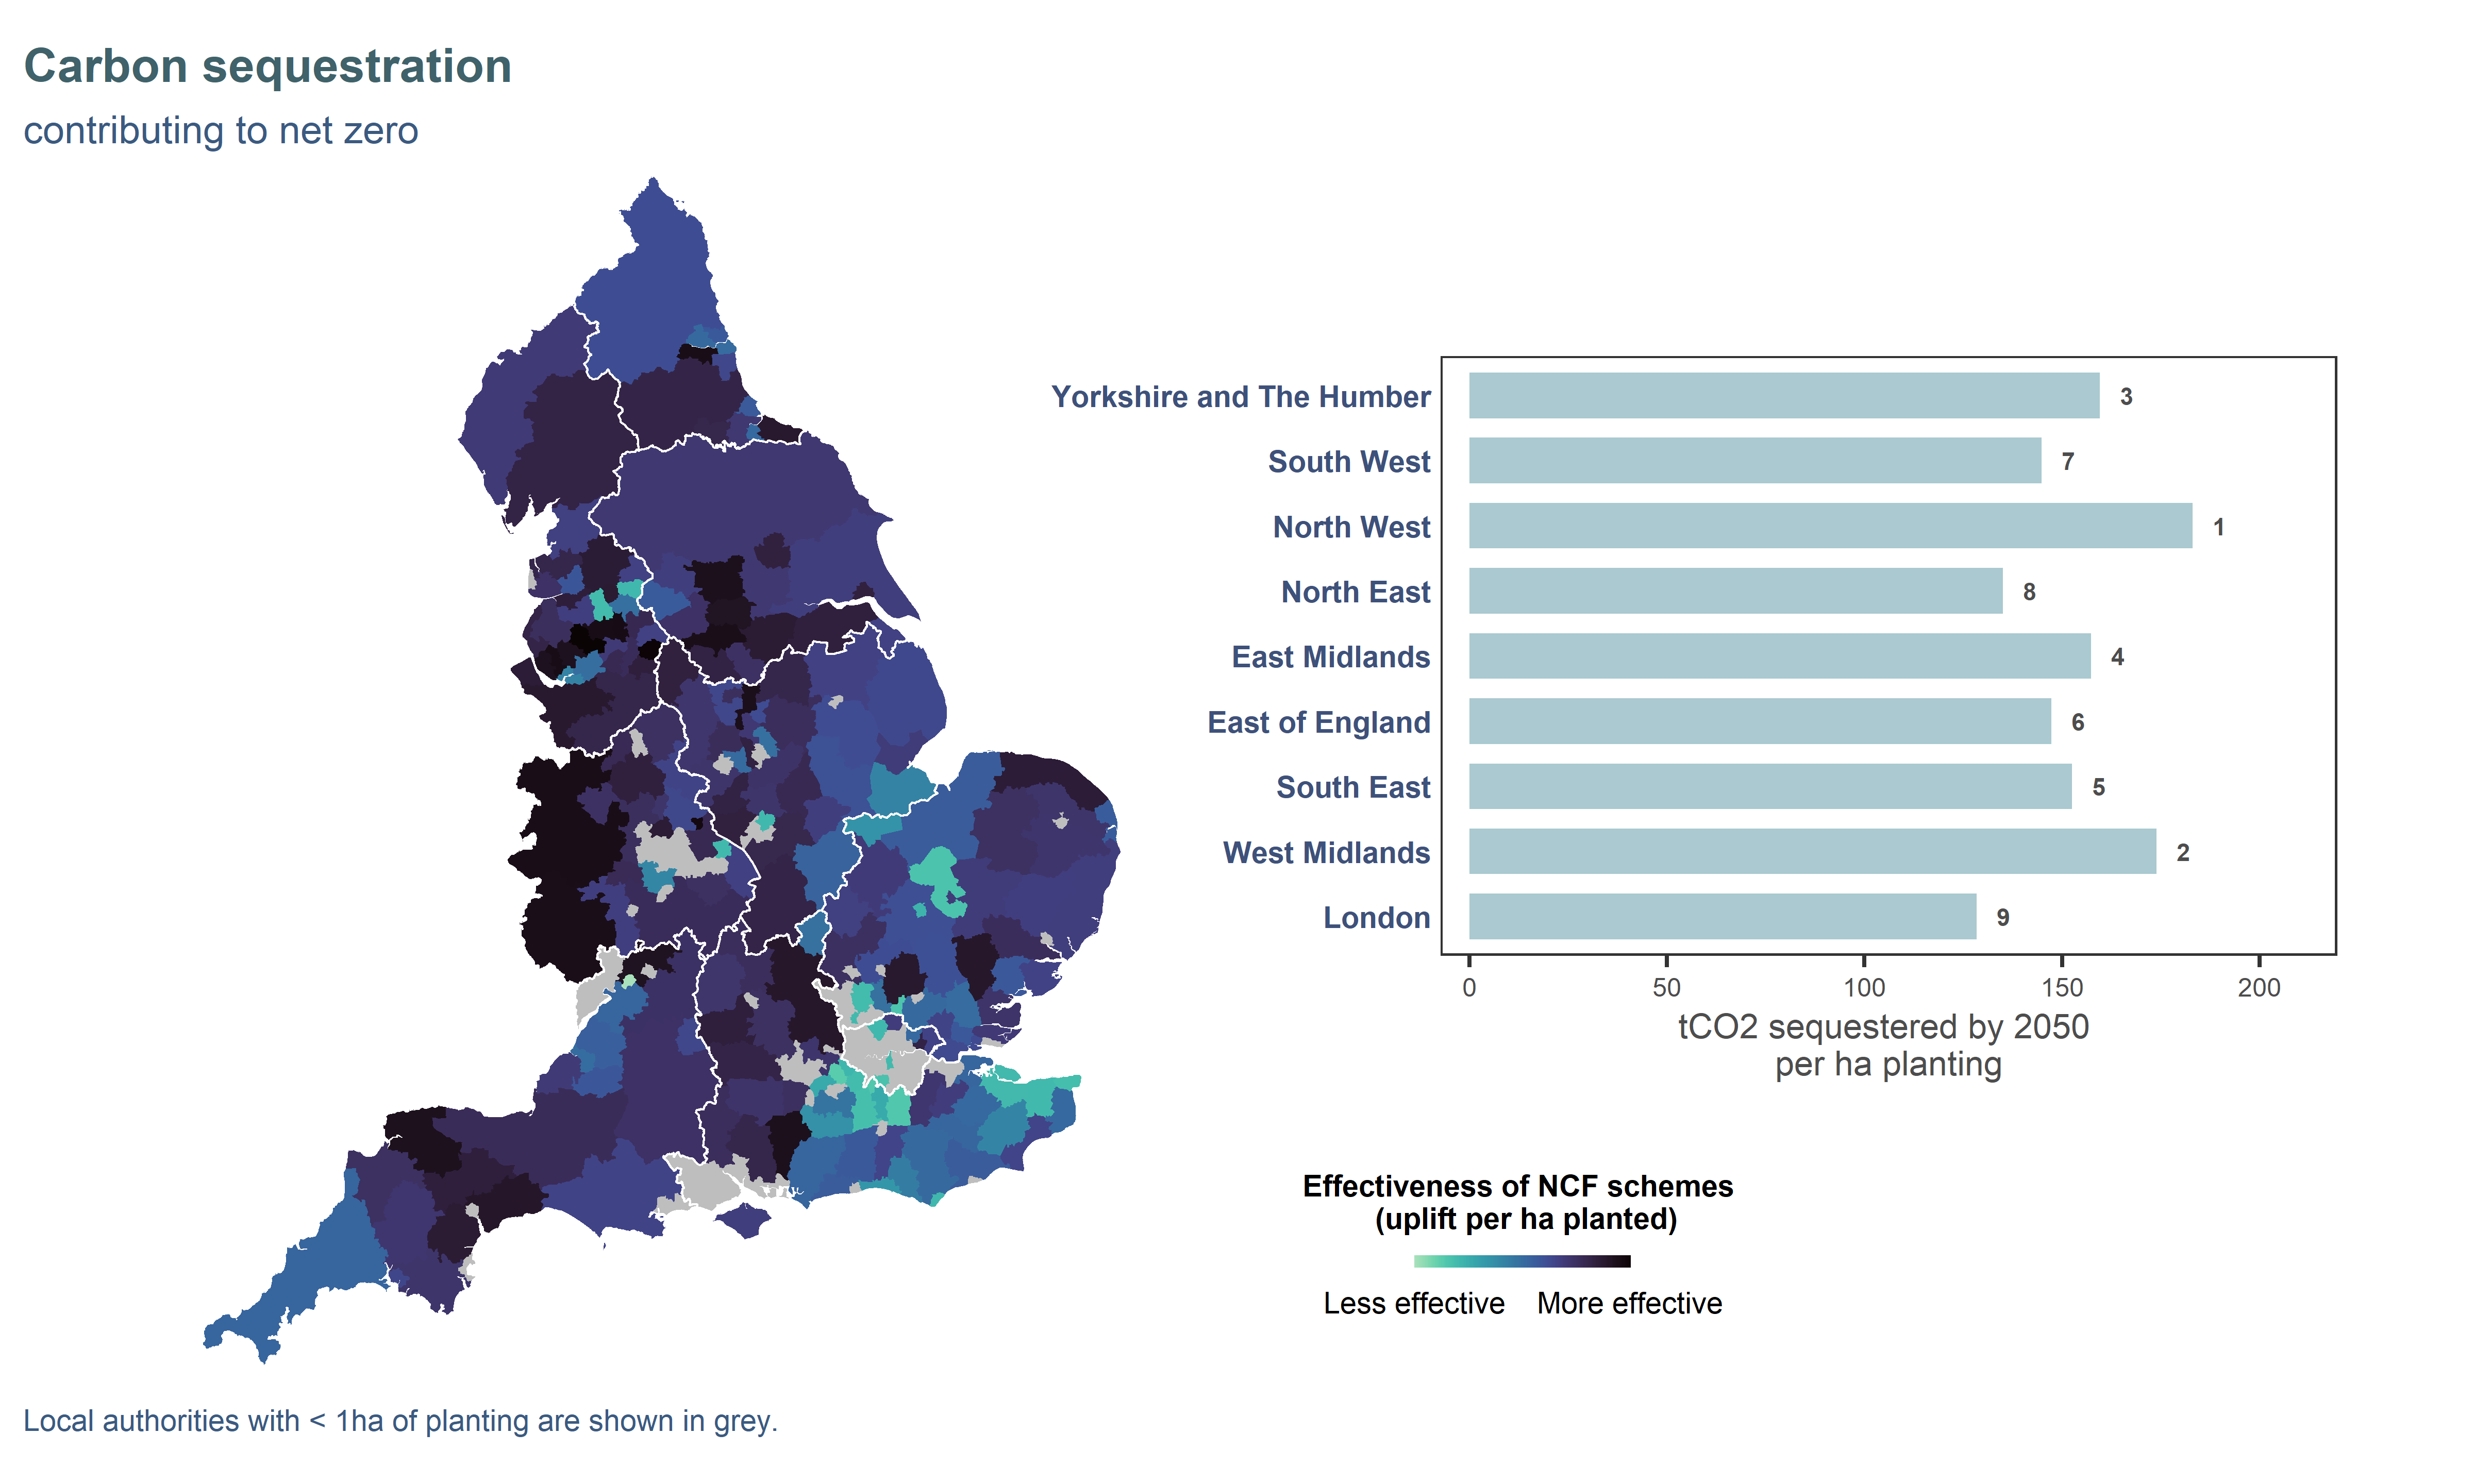
Figure ES2. Effectiveness of NCF planting to deliver carbon sequestration benefits at local authority (map) and regional (bar chart) level. Effectiveness is defined as the amount of benefit delivered per hectare of planting. Map data were log-transformed to improve contrast. Regions on the bar chart are ordered vertically from greatest to smallest amount of planting and annotated with their effectiveness ranking (1 = most effective, 9 = least effective).
Biodiversity
A connected landscape where wildlife can move and disperse within ecological networks allows species to thrive and increase their resilience to threats like climate change. On average, trees in the West Midlands and North West are projected to be most effective at creating new ecological networks, but there is a lot of variation within regions (Fig ES3), and this indicator is highly sensitive to local context (presence of habitat nearby). We refer the reader to the data portal to explore in more detail. New woodland creation can expand a network if situated outside but near the existing network. Woodland creation occurring within existing networks still plays a valuable role for biodiversity, but does not contribute to larger networks. Ecological networks were modelled for three dispersal sensitivities: the map shows network expansion under the medium (1km) dispersal scenario.
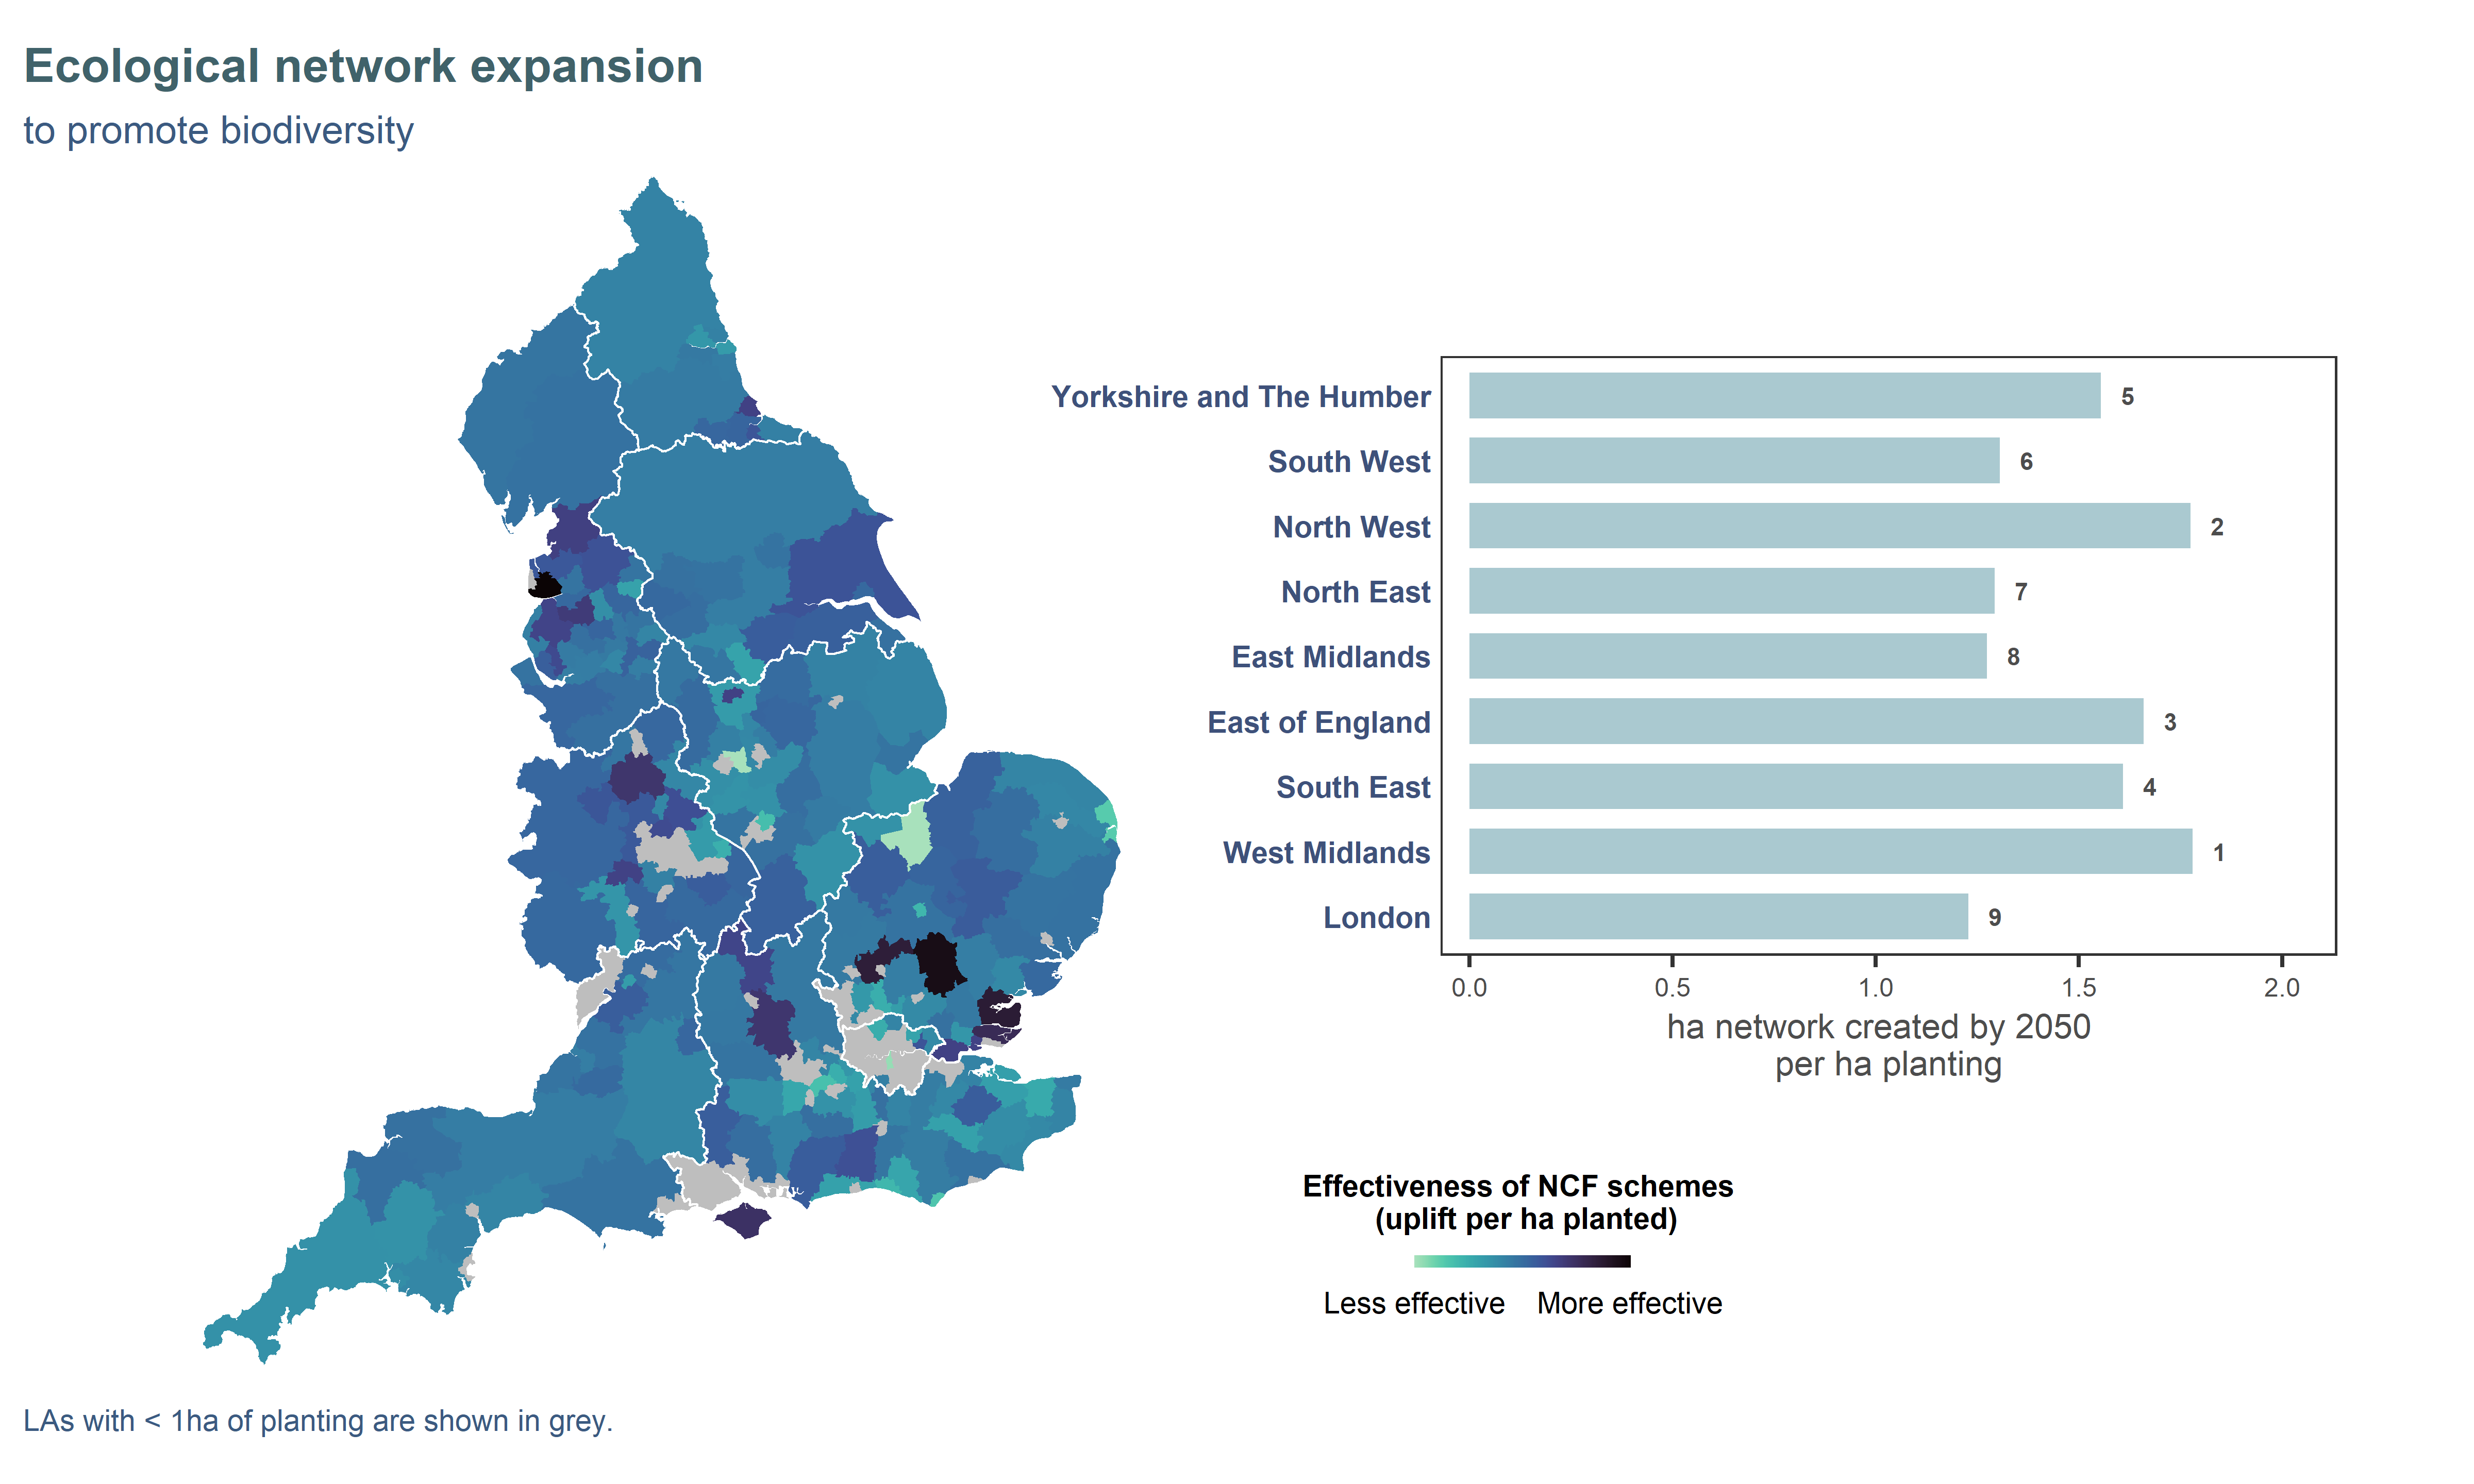
Figure ES3. Effectiveness of NCF planting to expand ecological networks for woodland species at local authority (map) and regional (bar chart) level. Effectiveness is defined as the amount of benefit delivered per hectare of planting. Map data were square-root-transformed to improve contrast. Regions on the bar chart are ordered vertically from greatest to smallest amount of planting and annotated with their effectiveness ranking (1 = most effective, 9 = least effective).
Air Quality
Pollution removal by vegetation is correlated with pollution levels: the higher the concentration in the air, the more trees can absorb or trap pollutants. The range of spatial effectiveness profiles reflect differences in emissions sources and atmospheric processes for the different pollutants. High effectiveness of particulate matter (PM) removal in eastern regions (South East, East Midlands, East of England) could be linked to intensive agriculture and arable farming, where soil disturbance combined with the generally drier climate can generate dust. Pollution removal is also projected to be highly effective in the London region, especially for sulfur dioxide (SO2) and nitrogen dioxide (NO2). However, because most London local authorities have less than 1 hectare of planting (grey areas on map), the total improvement in air quality is likely to be small despite the high per-hectare effectiveness.
Figure ES4. Effectiveness of NCF planting to remove air pollution at local authority (map) and regional (bar chart) level. The six pollutants evaluated are fine particulate matter (PM2.5), particulate matter (PM10), sulfur dioxide (SO2), ammonia (NH3), nitrogen dioxide (NO2) and ozone (O3). Effectiveness is defined as the amount of benefit delivered per hectare of planting. Map data were square-root-transformed to improve contrast. Regions on the bar chart are ordered vertically from greatest to smallest amount of planting and annotated with their effectiveness ranking (1 = most effective, 9 = least effective).
Flood Regulation
Trees can contribute to flood regulation by intercepting rainfall, using up ground water, and acting as a flood barrier to slow down runoff. Due to the coarse resolution of published data, this indicator does not exhibit much spatial variability (similar regional effectiveness). At the local authority level, areas with higher effectiveness are those where a higher proportion of planting is located in the floodplain.
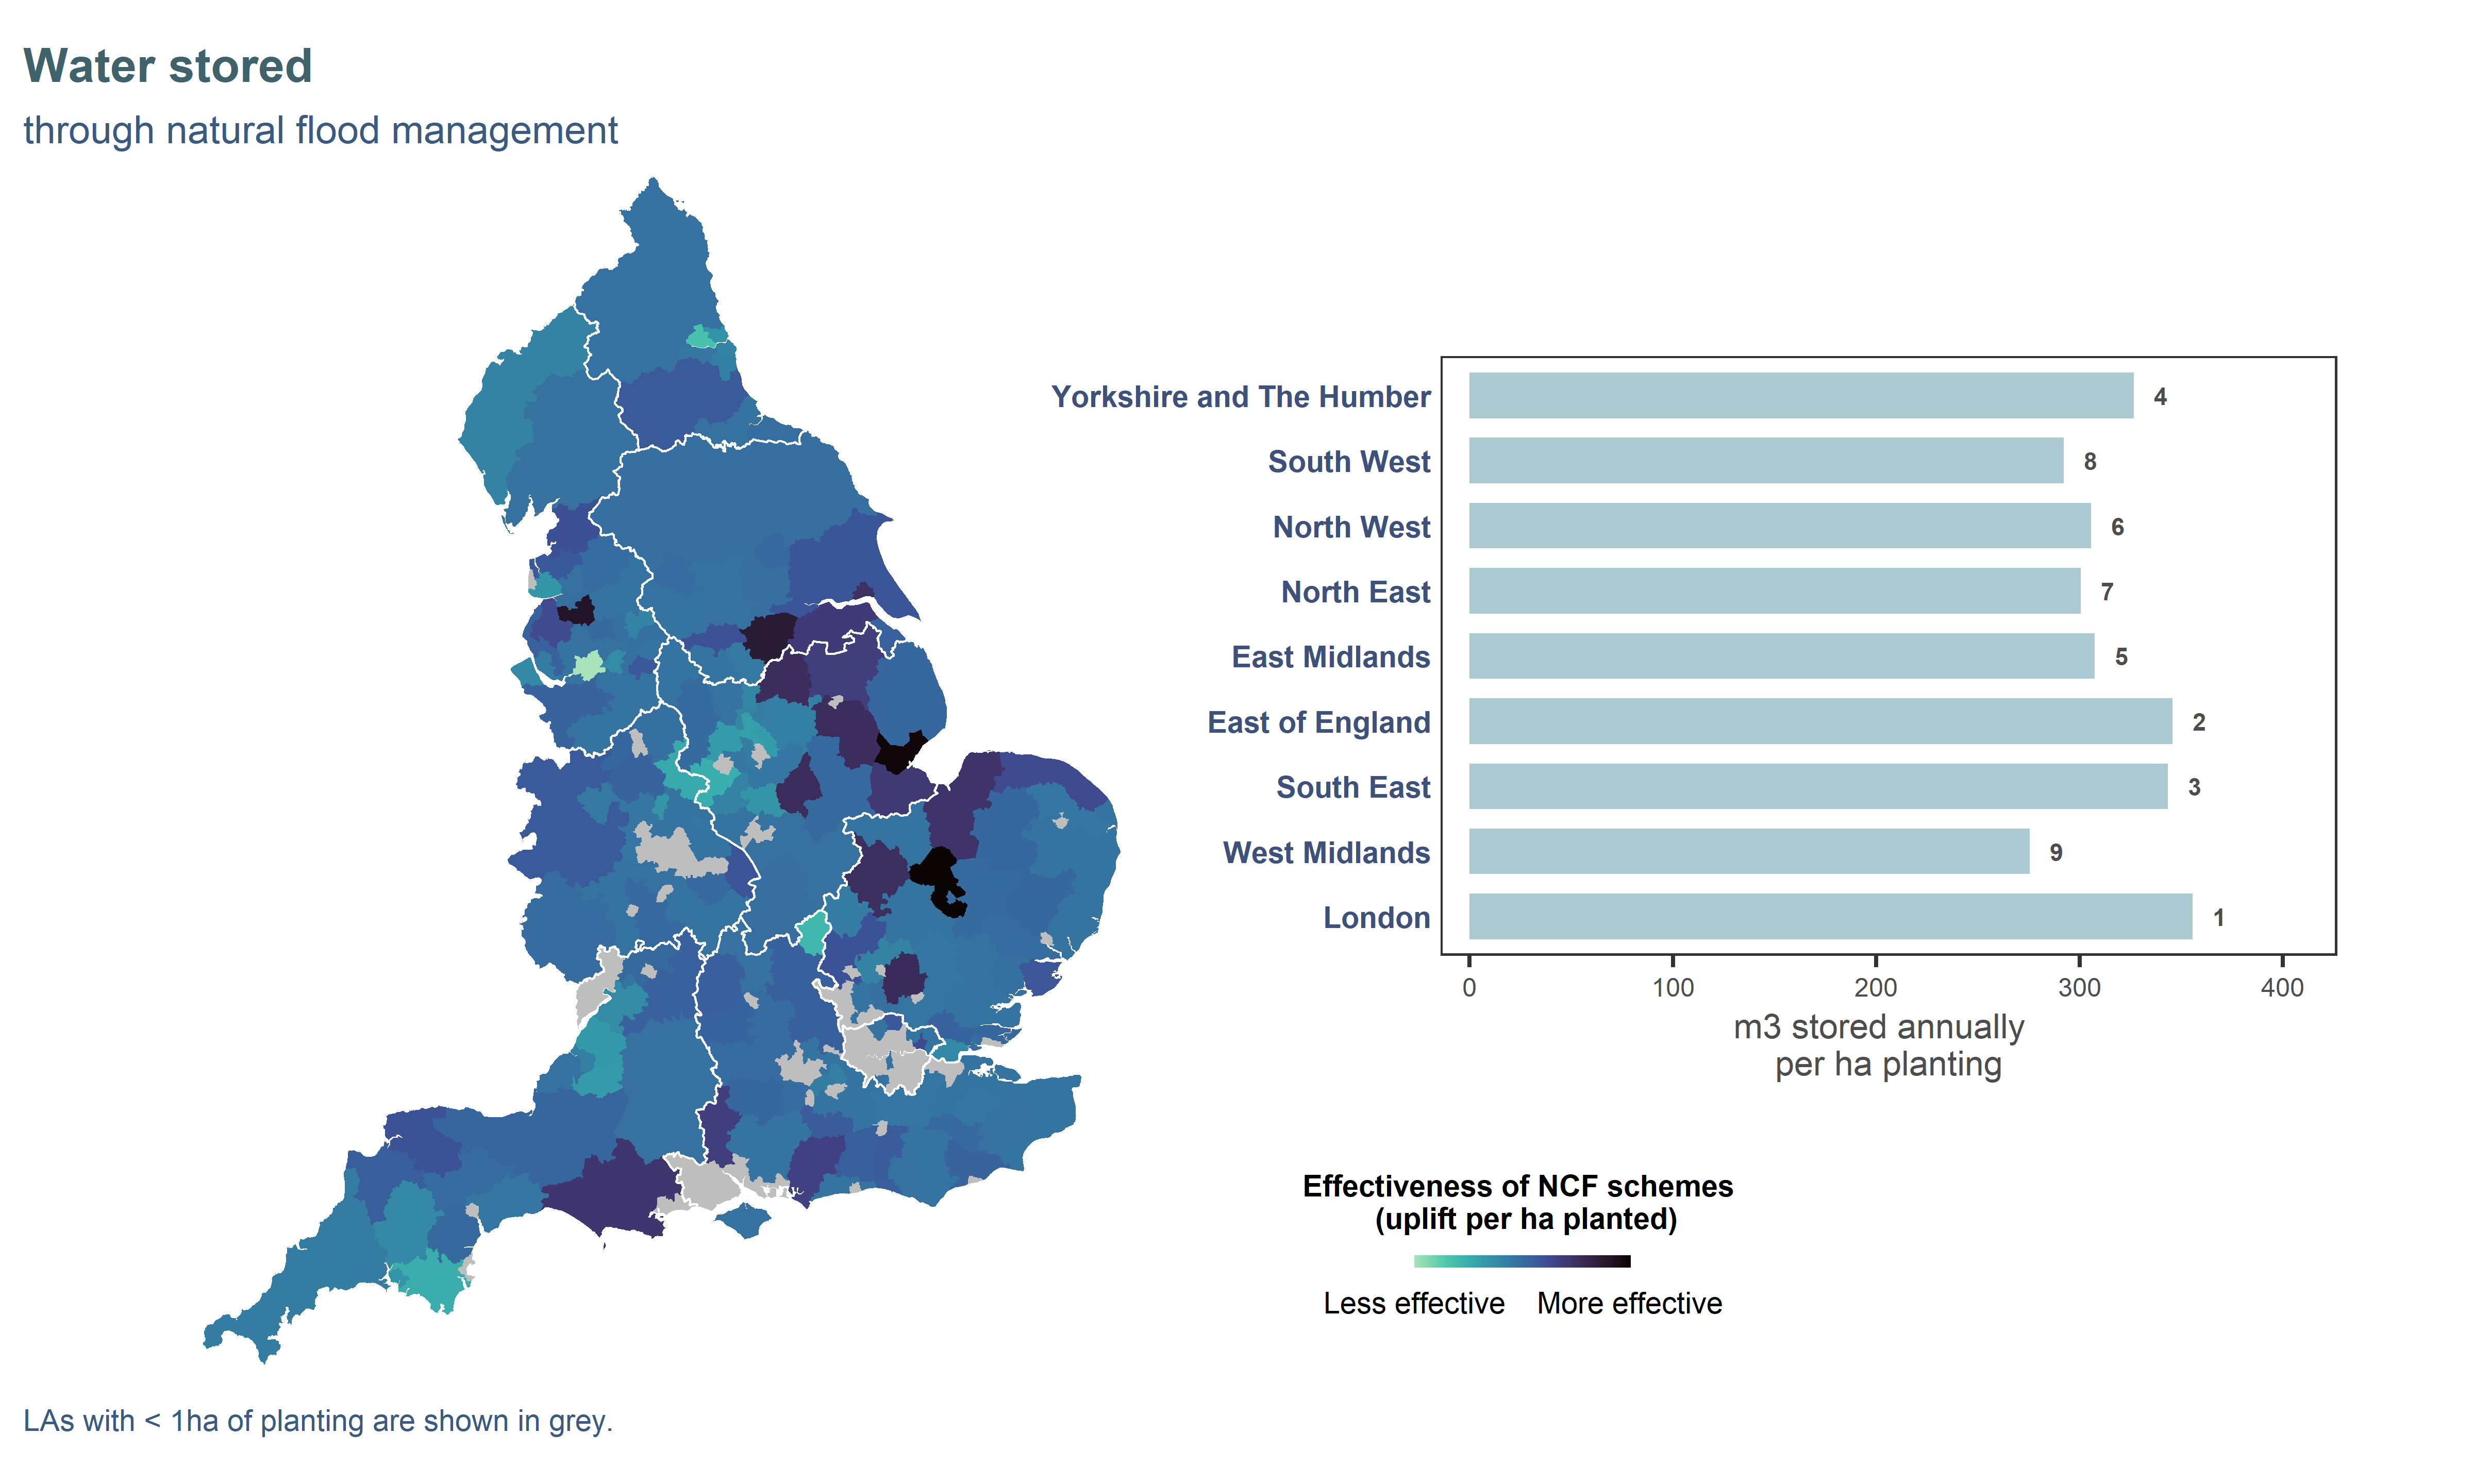
Figure ES5. Effectiveness of NCF planting to store water at local authority (map) and regional (bar chart) level. Effectiveness is defined as the amount of benefit delivered per hectare of planting. Map data were square-root-transformed to improve contrast. Regions on the bar chart are ordered vertically from greatest to smallest amount of planting and annotated with their effectiveness ranking (1 = most effective, 9 = least effective).
Water Quality
Like with air quality benefits, the removal of nutrients affecting water quality is expected to be highest in areas where inputs (such as fertilisers and animal manure) are high to begin with. Trees mostly contribute to better water quality by replacing land use (e.g. stopping use of fertilisers), but also change soil properties and slow the flow of water, limiting erosion and runoff. For nitrogen (N), NCF planting may be particularly effective in regions where arable farming is important. For phosphorus (P), the effectiveness is highest in the North, where the wetter climate and hilly topography increase runoff and export of this pollutant.
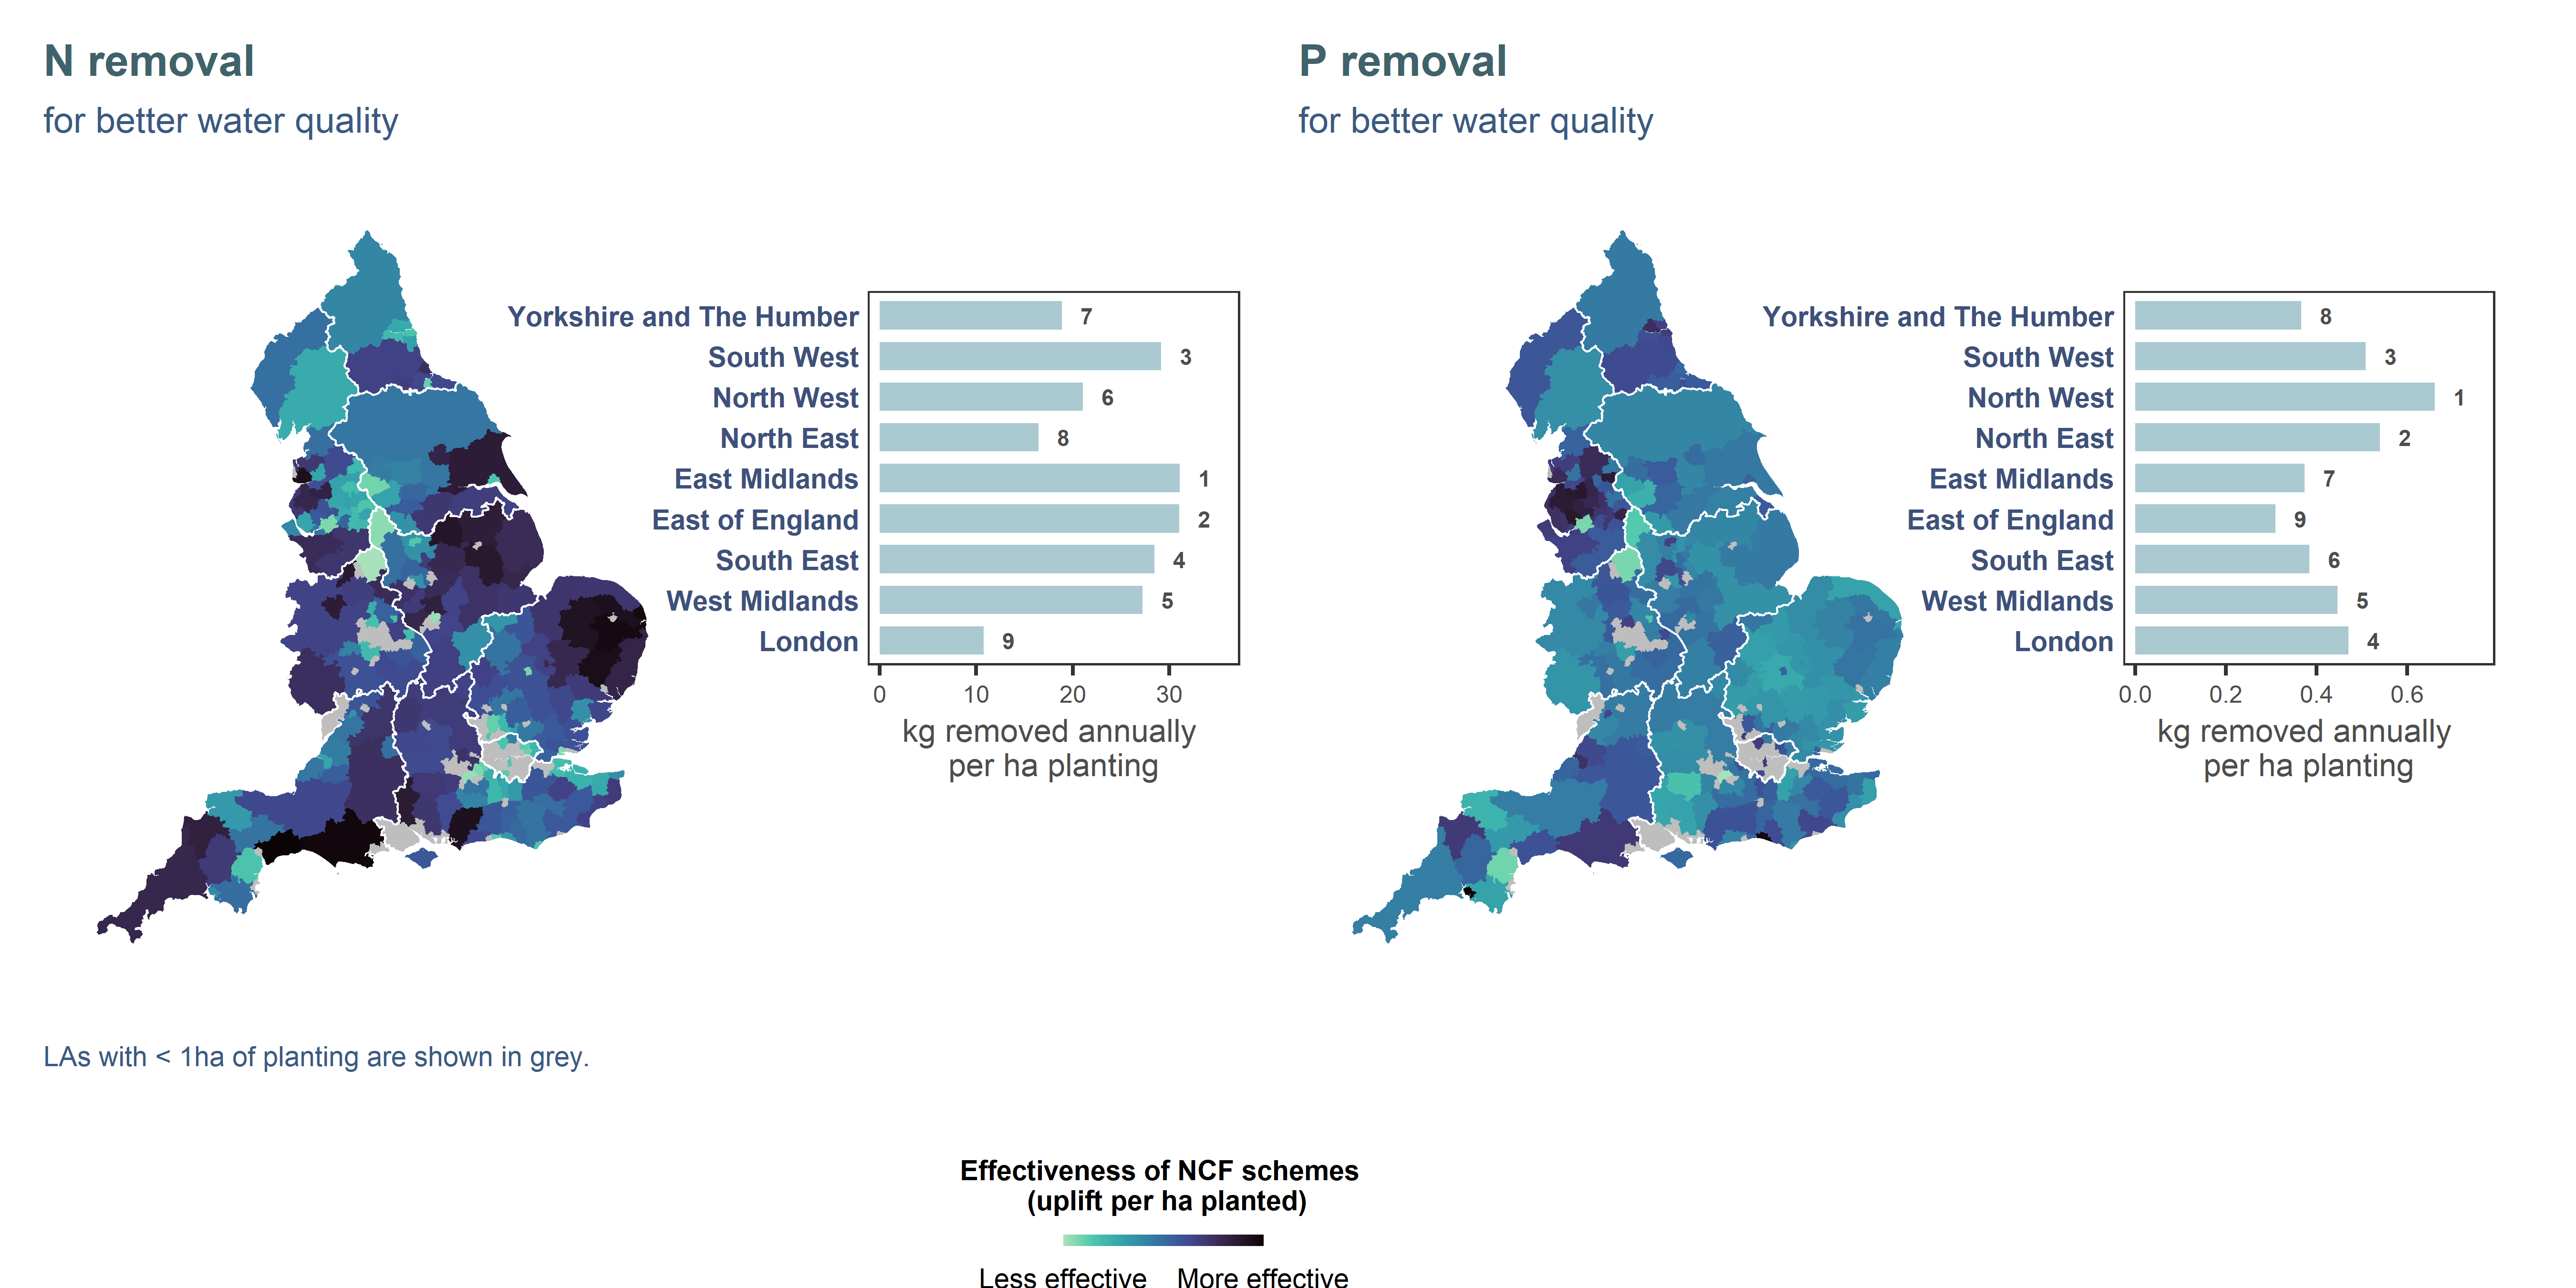
Figure ES6. Effectiveness of NCF planting to reduce pollutants contributing to water quality issues at local authority (map) and regional (bar chart) level. Effectiveness is defined as the amount of benefit delivered per hectare of planting. Map data were square-root-transformed to improve contrast. Regions on the bar chart are ordered vertically from greatest to smallest amount of planting and annotated with their effectiveness ranking (1 = most effective, 9 = least effective).
Access to Nature
Woodland provides important opportunities for recreation, supporting physical and mental wellbeing. We estimate that 1.4 million households are within a 15-minute walk of an accessible NCF site. Most households (ca. 80%) in England already have a green or blue space within a 15-minute walk (Defra 2026a), so NCF planting rarely brings more households under the 15-minute commitment. However, far fewer households can reach wooded sites within a 15-min walk, so NCF provides sizable gains when considering specifically access to woodland, particularly in the greater London region, where a few sites may serve a very dense population. There is a lot of variation within regions, as this indicator is highly sensitive to local context (configuration of green spaces and household density and proximity). We refer the reader to the data portal to explore in more detail.
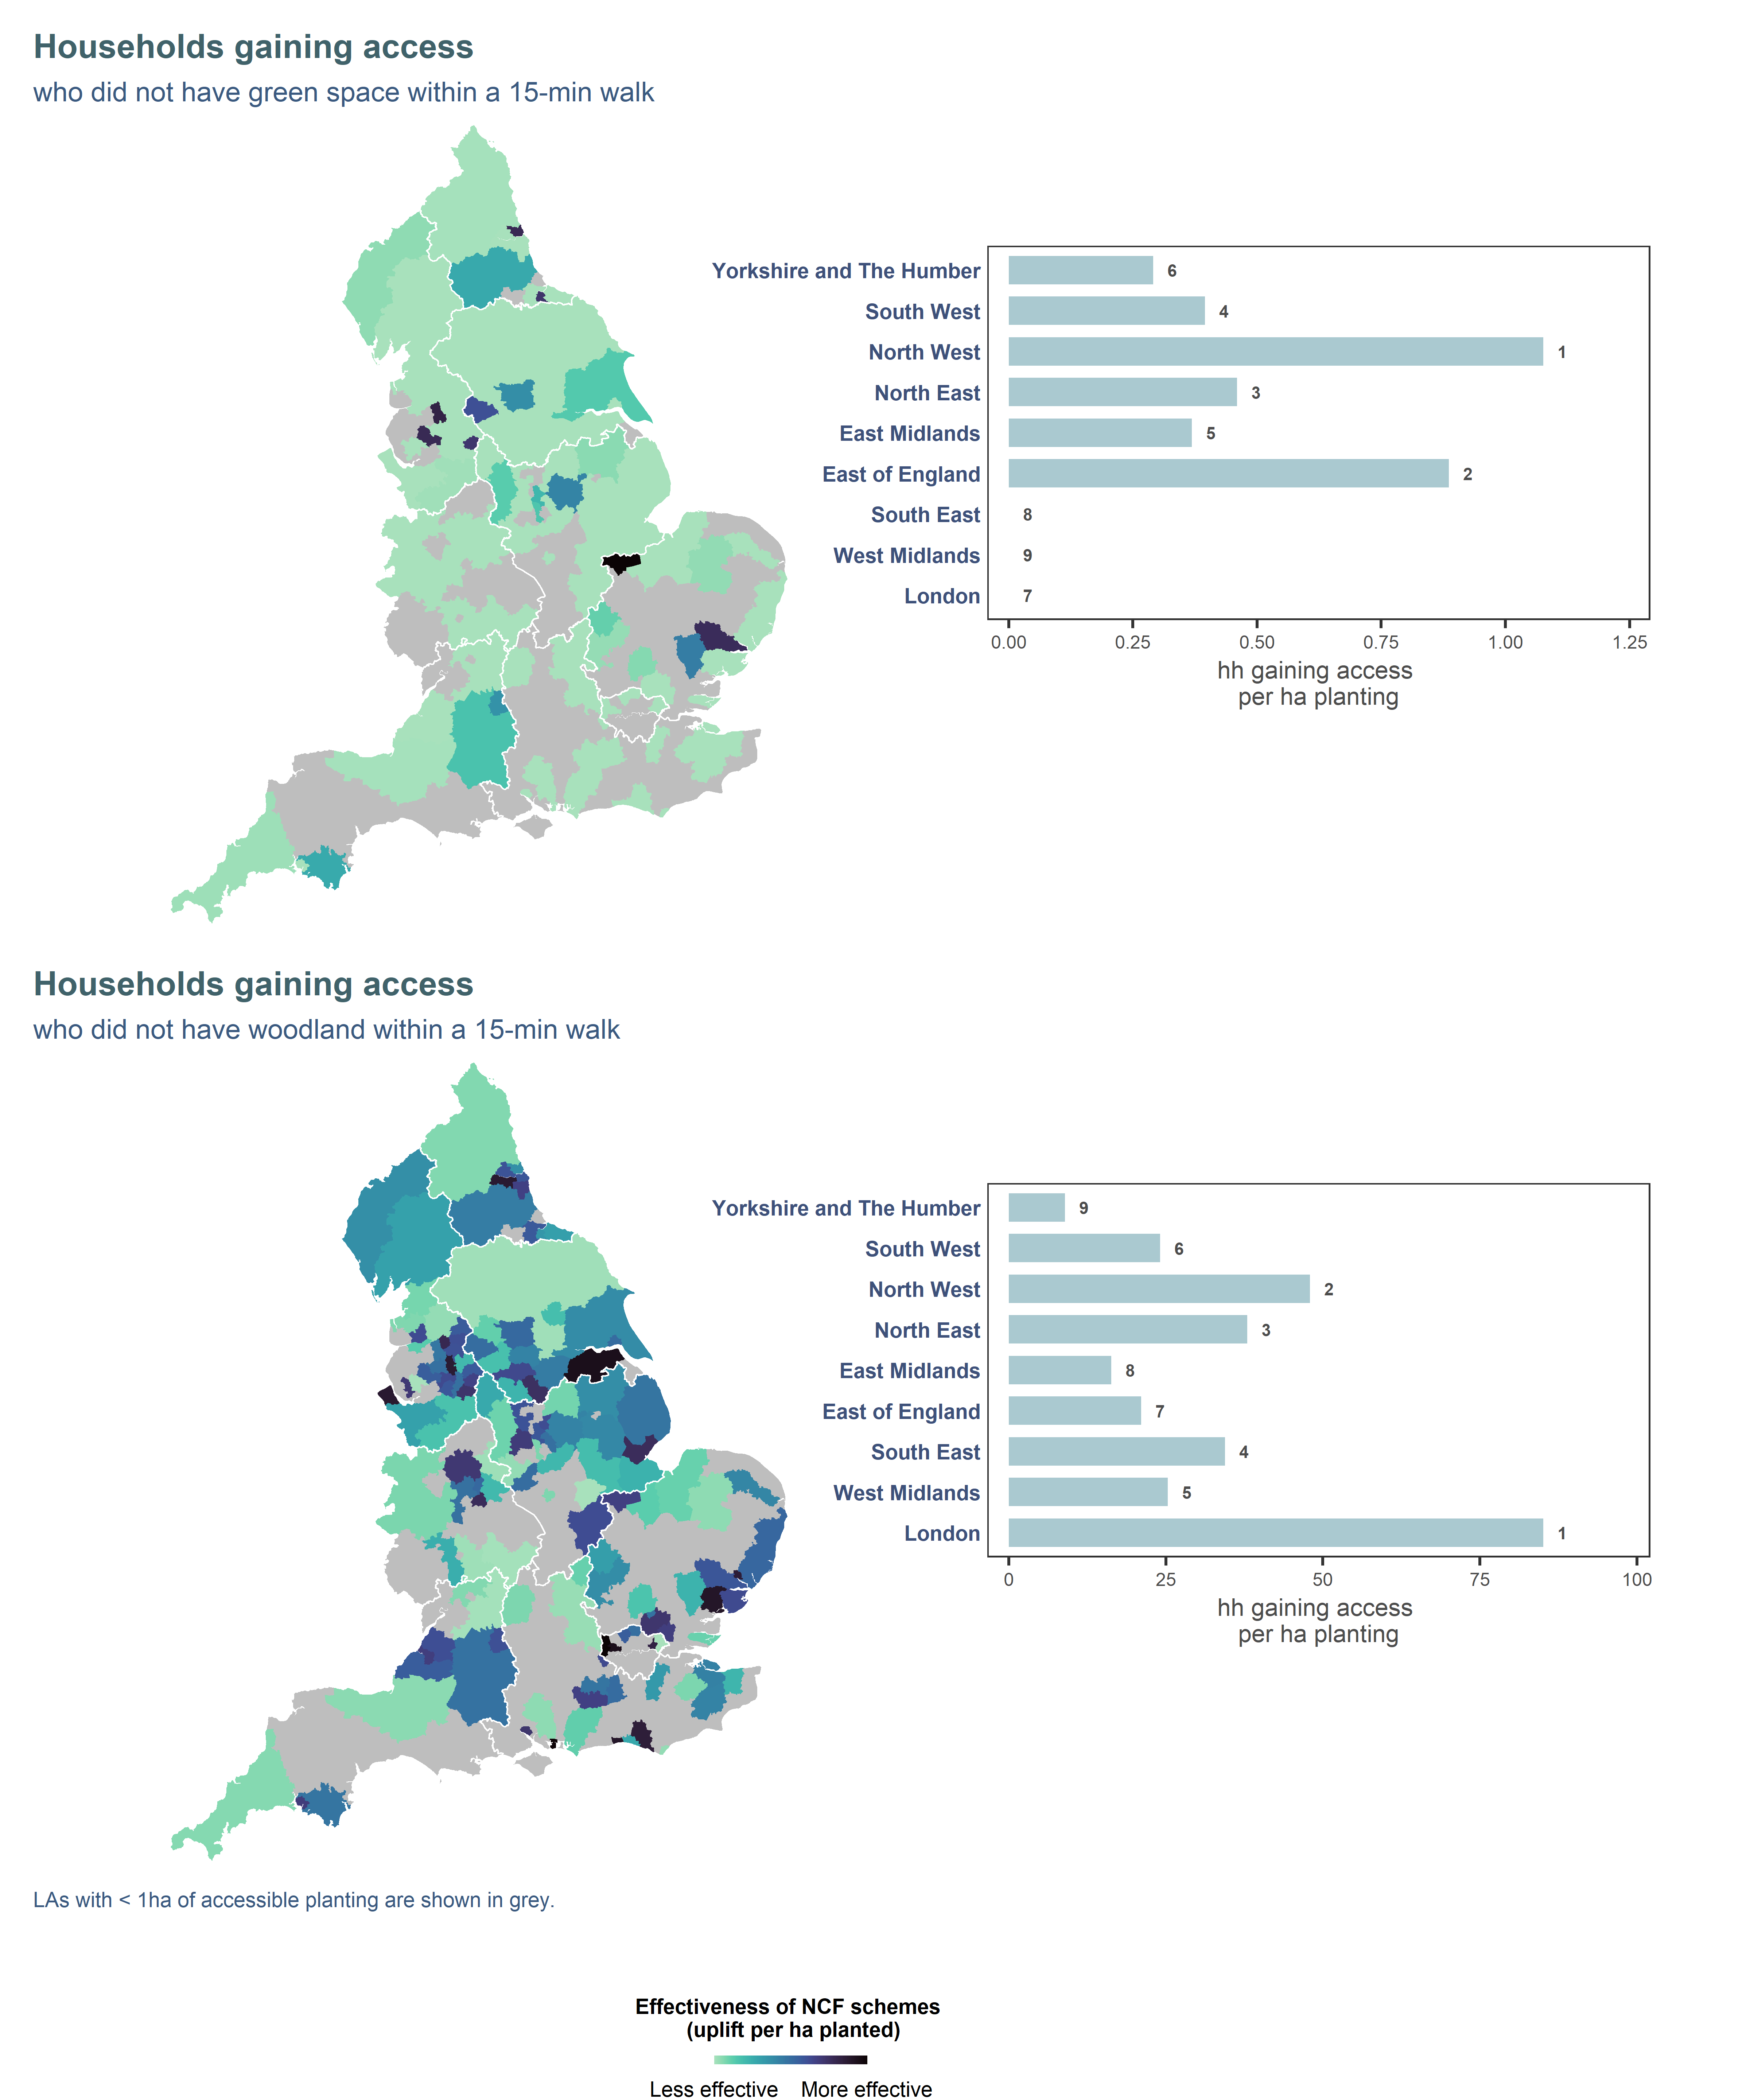
Figure ES7. Effectiveness of NCF planting to provide accessible nature spaces within a 15-minute walk at local authority (map) and regional (bar chart) level. Effectiveness is defined as the amount of benefit delivered per hectare of planting. Map data were log-transformed to improve contrast. Regions on the bar chart are ordered vertically from greatest to smallest amount of planting and annotated with their effectiveness ranking (1 = most effective, 9 = least effective).
References
Technical lead, S.AngersBlondin@ljmu.ac.uk↩︎
NC Hub lead, C.Bowe@ljmu.ac.uk↩︎