Chapter 4 Biodiversity
4.1 Indicator definition
The UK, like most other countries worldwide, has been experiencing an ongoing loss of biodiversity for decades, due to key pressures like climate change and habitat loss (Burns et al. 2023). England and the UK have a number of legally-binding targets to reduce or even halt species loss (DAERA 2025; Ares and Wentworth 2024). In addition to these targets, the government is now implementing ambitious measures, including the 30by30 commitment to protect 30% of land and marine areas by 2030 (DEFRA 2024) and the creation of Nature Recovery Networks designed to re-establish ecological connectivity and restore key habitats (DEFRA 2020).
These policies not only reinforce existing conservation frameworks but also aim to reverse biodiversity loss and strengthen ecosystem resilience for future threats. As part of this wider strategy, the Nature for Climate Fund programme is creating 14,533 ha of new woodland and trees, likely providing food, refuge and breeding habitat for a range of species across multiple taxonomic groups. Biodiversity is a complex and multi-faceted topic, and the duration and scope of this project prompted a pragmatic approach, with the aim of indicating whether NCF is on the right trajectory to deliver biodiversity benefits.
We developed metrics under two main categories for this indicator. The connectivity metric gives an idea of how the landscape currently functions for species (habitat-as-proxy approach), and where NCF sites may be enhancing connectivity or expanding ecological networks. The refugia metric draws on species range shift projections (Pearce-Higgins et al. 2015; Critchlow et al. 2022) to assess where NCF sites may assist priority woodland species under projected climate change.
4.1.1 Connectivity
Habitat fragmentation is a significant threat to biodiversity. The isolation of woodlands restricts species movement, diminishes genetic diversity and heightens vulnerability to environmental changes, making it harder for wildlife to adapt to shifting climate conditions (Synes et al. 2020). The Nature Recovery Network aims to create and restore corridors and stepping-stones to enable wildlife populations to recover, grow, move and thrive in a changing climate (DEFRA 2020).
An ecological network is defined as a set of interconnected habitat patches and the surrounding environment within which species can disperse. This indicator evaluates the potential of NCF planting to improve the connectivity of woodland habitats by quantifying the projected change in the extent of ecological networks. We modelled networks for woodland species (expected gains), but also for grassland species to examine any potential tradeoffs where planting might create barriers for non-woodland species. The indicator runs a cost-distance analysis which considers the dispersal ability of an “average” species and the resistance (cost) of the landscape to its dispersal, essentially showing areas of the landscape which are “accessible” to a species from its core habitat.
4.1.2 Refugia
Climate modelling has shown that woodland-associated species are among the most vulnerable to climate change in the United Kingdom (Berry et al. 2002; Pearce-Higgins et al. 2015). As temperatures rise and precipitation patterns shift, these species may move to new areas in search of suitable conditions. NCF planting has the potential to facilitate these range shifts by enhancing connectivity and providing new or expanded refugia for woodland species adapting to a changing climate.
This metric measures the number of priority woodland species that are predicted to be gained or lost from NCF sites in response to climate change. We compared the current and predicted climate suitability of key woodland species under climate change scenarios, based on previous work commissioned by Natural England (Pearce-Higgins et al. 2015; Critchlow et al. 2022). Reliable and spatially precise species occurrence data is often limited to certain taxonomic groups and held locally with varying spatio-temporal coverage by records centers. Using the existing evidence base developed for Natural England means this indicator benefited from the most comprehensive and high-resolution biodiversity datasets available for the UK, enabling a robust assessment of projected range shifts.
4.2 Connectivity results
NCF planting is expected to create, at maturity, between 13,620 and 24,692 hectares of ecological network for woodland species (Table 4.1). This is around 9-17 times the size of Lake Windermere, the largest lake in England. An ecological network is the “usable” space in the landscape by species associated with a certain habitat. It includes areas of primary habitat, as well as surrounding areas within which dispersal to other habitat patches is possible.
Our models assumed that woodland creation above 0.1 ha in size could form new habitats, and that smaller schemes and trees outside woodland can still benefit connectivity (depending on their spatial configuration), by creating corridors and stepping stones that facilitate species movement. Networks were modelled with three levels of sensitivity (Table 4.2) to reflect how species with different dispersal abilities experience the landscape.
| Woodland network change (ha) | Grassland network change (ha) | |||||
|---|---|---|---|---|---|---|---|
Region | Planted area (ha) | Short dist. | Medium dist. | Long dist. | Short dist. | Medium dist. | Long dist. |
Yorkshire and The Humber | 3,040 | 2,965 | 4,723 | 5,543 | -802 | -775 | -751 |
North West | 2,156 | 2,168 | 3,825 | 4,432 | -283 | -345 | -348 |
South West | 2,861 | 2,475 | 3,733 | 3,972 | -125 | -184 | -262 |
East of England | 1,476 | 1,538 | 2,447 | 2,645 | -22 | -44 | -57 |
North East | 1,627 | 1,369 | 2,103 | 2,401 | -138 | -131 | -152 |
East Midlands | 1,543 | 1,202 | 1,964 | 2,172 | -35 | -53 | -81 |
South East | 1,036 | 1,088 | 1,663 | 1,791 | -3 | 0 | 10 |
West Midlands | 776 | 734 | 1,388 | 1,587 | -61 | -54 | -51 |
London | 107 | 82 | 128 | 150 | -3 | -6 | -5 |
Total | 14,623 | 13,620 | 21,974 | 24,692 | -1,473 | -1,591 | -1,697 |
By definition, ecological connectivity is a function of how habitats interact together, so this indicator is better suited to landscape-scale geographies (no site-level results are calculated for this metric). We calculated a standardised effectiveness metric (Figure 4.1) that represents the area of network created per unit area of planting. Higher values suggest that the planting was located in places that maximise connectivity benefits. Areas with lower effectiveness scores are likely to represent places where planting occurred within the existing woodland network, thereby consolidating but not expanding it.
NCF planting does not appear to cause significant obstructions to non-woodland species. We modelled grassland ecological networks pre- and post- planting and found losses around 10 times smaller than the predicted gains in woodland network (Figure 4.1). Between 79% and 89% of local authorities saw no significant change (< 0.1 ha of gains or losses per hectare planted) in their grassland network extent. Interestingly, the direction of the change was variable, with some local authorities showing gains in grassland networks post-planting and others showing losses (Figure 4.1). Losses were more common in the short-dispersal scenario, where woodland creation on or near grassland could impede less mobile species. On the other hand, for species with higher dispersal abilities, the creation of natural habitats (even if not a preferred habitat) may be improving the permeability of the wider landscape in places that are very built-up or intensively farmed.
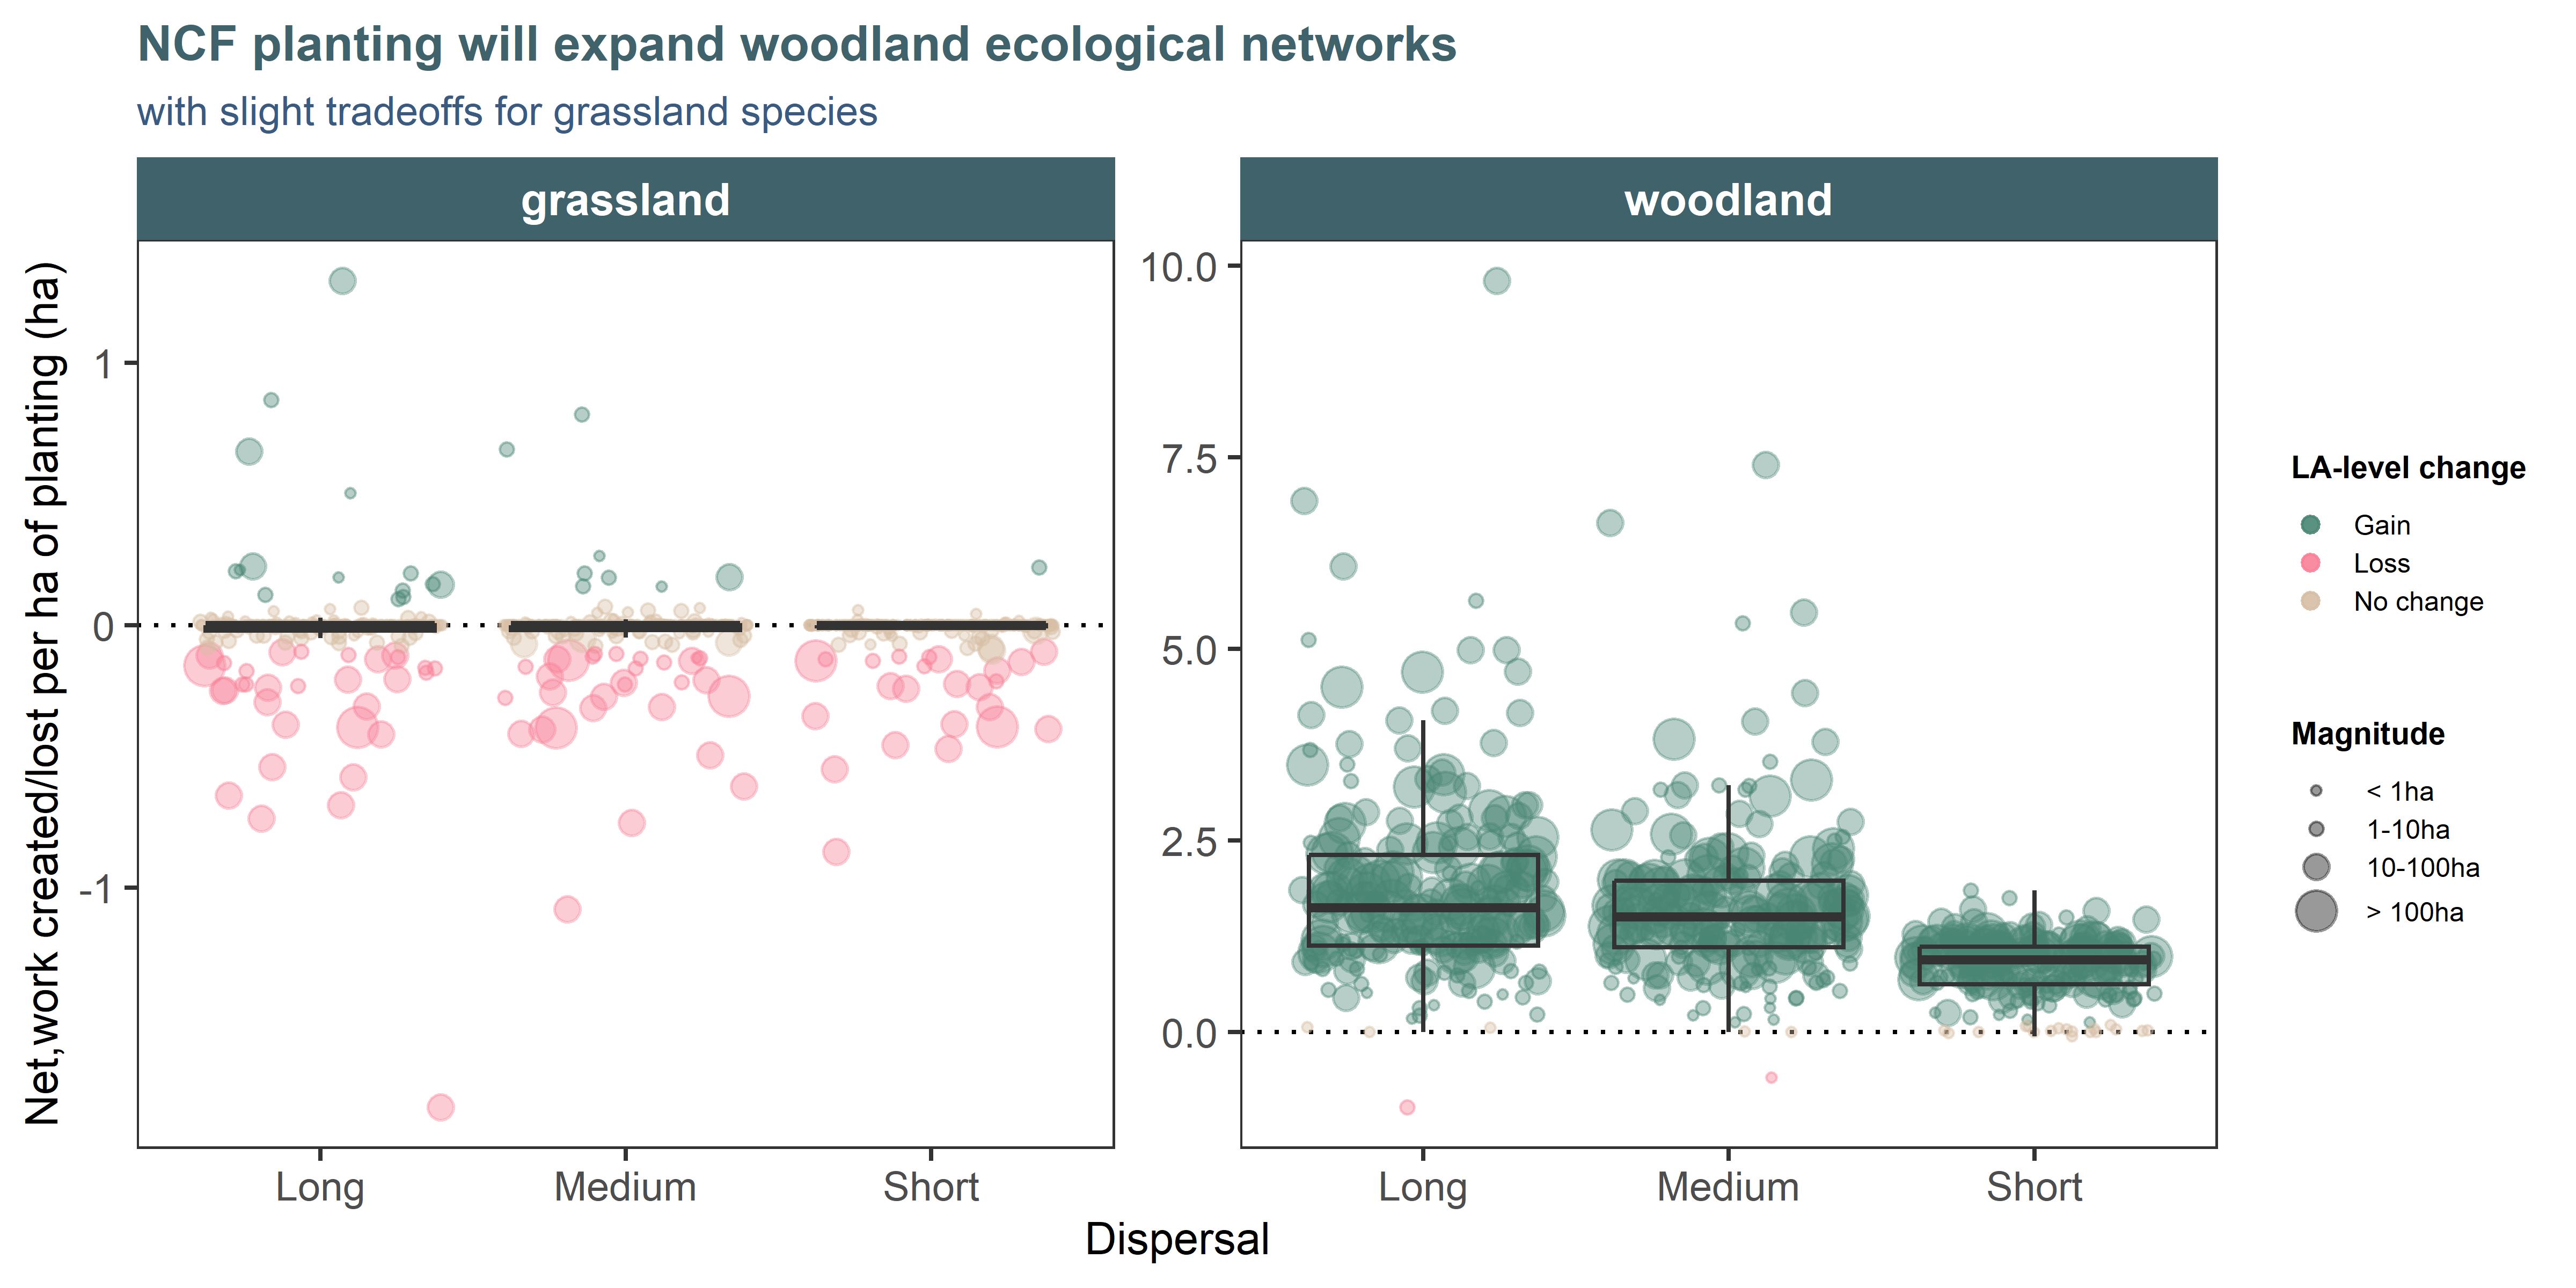
Figure 4.1: The effectiveness of NCF planting to increase the extent of woodland ecological network (per hectare of planting) is variable across local authorities (individual points; 207 LAs with >1ha of planting). Predicted gains in the woodland network extent are much higher than projected losses in grassland networks (note the different y axis scales). To capture uncertainty with this metrics, networks have been run at three sensitivities to represent species with short, medium and long dispersal capabilities. NB: The small losses in woodland network are due to imprecisely digitised schemes of sparse planting that appear to replace baseline woodland habitats. We considered gains or losses of less than 0.1ha per ha of planting to represent no significant change.
4.3 Refugia results
Under baseline climatic conditions, both woodland and TOW species richness is highest in the southern half of England (Figure 4.2). However, under future climate change, a shift towards higher latitudes and altitudes is projected, particularly for woodland-associated species. These projected latitudinal shifts are reflected in the NCF planting data (Figure 4.3). Under baseline conditions, the South East and South West support the joint highest woodland species richness (24 priority species). Under future climates, however, these regions are projected to support among the fewest species, with richness declining to 11–14 woodland species in the South East and 13–16 species in the South West, depending on whether a 2°C or 4°C warming scenario is considered.
Conversely, the North East and North West support the lowest woodland species richness (12 and 16 priority species, respectively) under baseline conditions, but under future climate could support some of the highest richness, increasing to 18–20 species in the North East and 22–23 species in the North West. The projected richness of TOW species shows a similar but less pronounced pattern, with decreases across southern and central regions and modest increases relative to baseline conditions in the North East (from 16 to 17 species) and the North West (from 15 to 16–17 species).
The projected trends can be explained by the species gains in the northern planting sites (especially for woodland species), with few losses, versus the significant losses in the southerly planting sites, with no gains (Figure 4.4) (but see Assumptions and limitations section). This suggests that while northern NCF sites currently support the fewest priority species, they could act as refuges under future climate change, provided species are able to track the shifting climatic conditions.
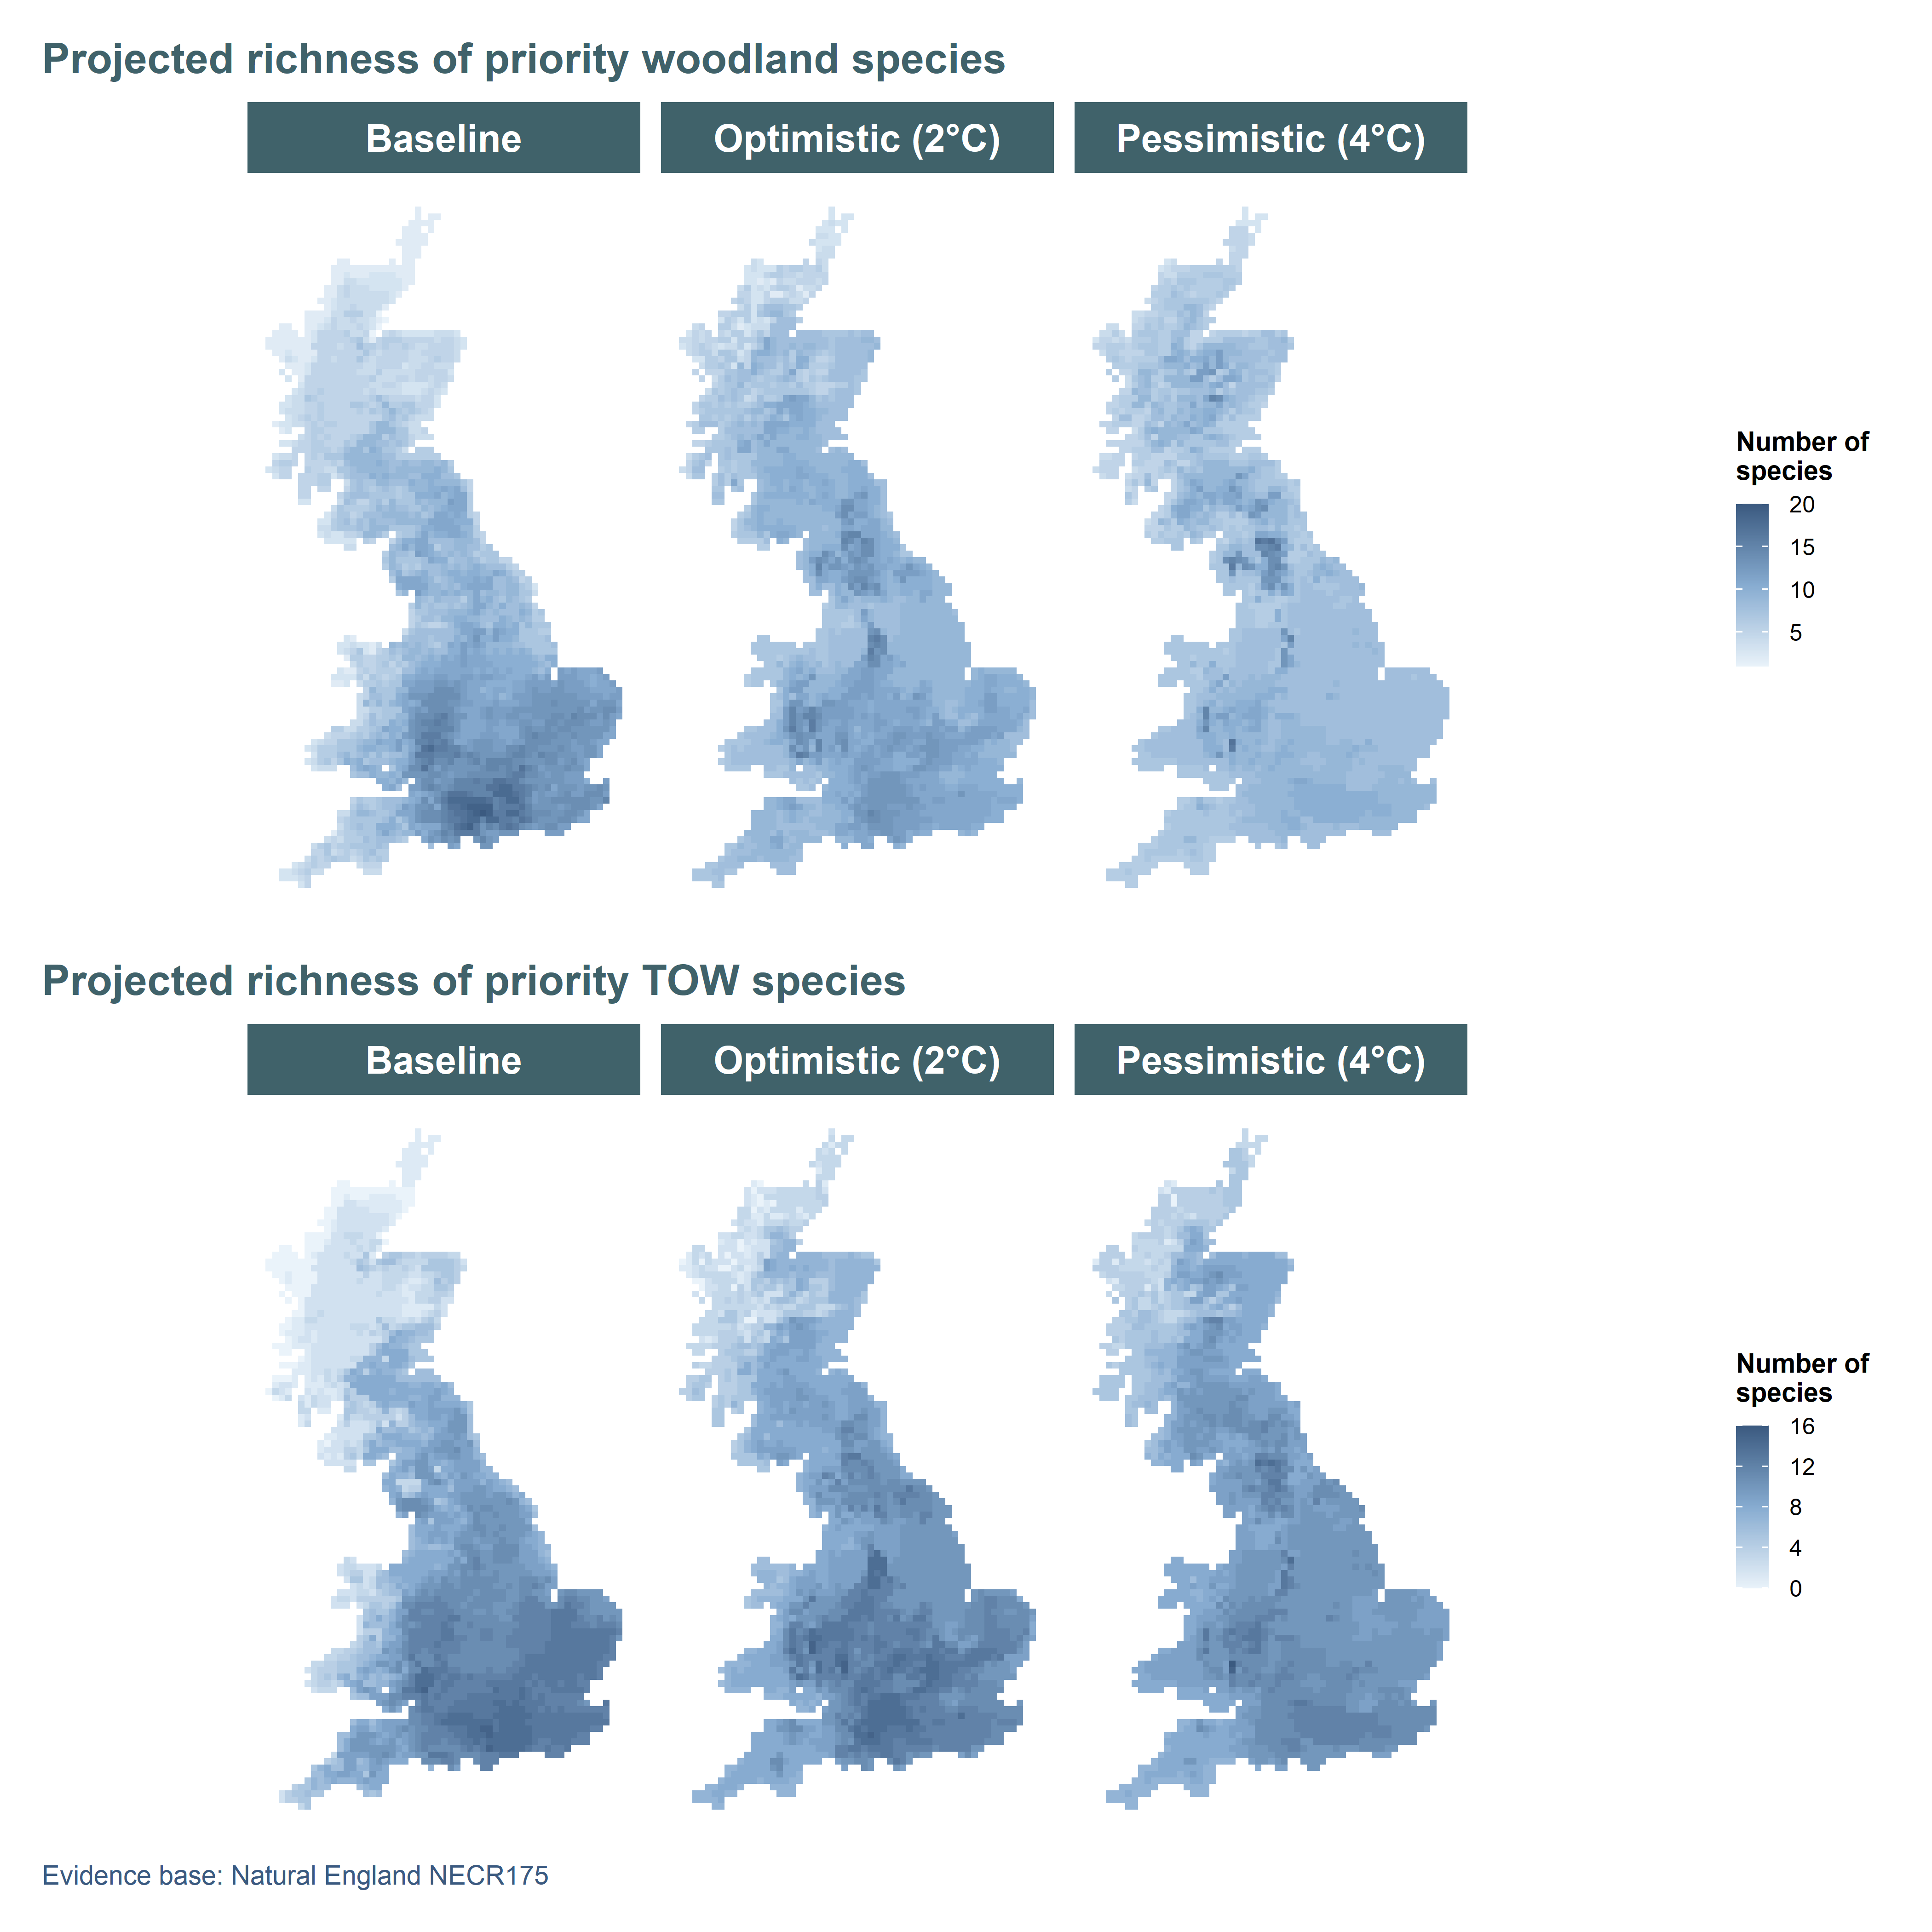
Figure 4.2: Projected woodland and TOW species richness of 30 priority plant and bird species under baseline (1961–1990) and projected future climate (2070–2099). Future conditions are based on an ‘Optimistic’ scenario (B1) and a more ‘Pessimistic’ scenario (A1B) from the UKCP09. Climate suitability maps for each species were taken from Critchlow et al. (2022).
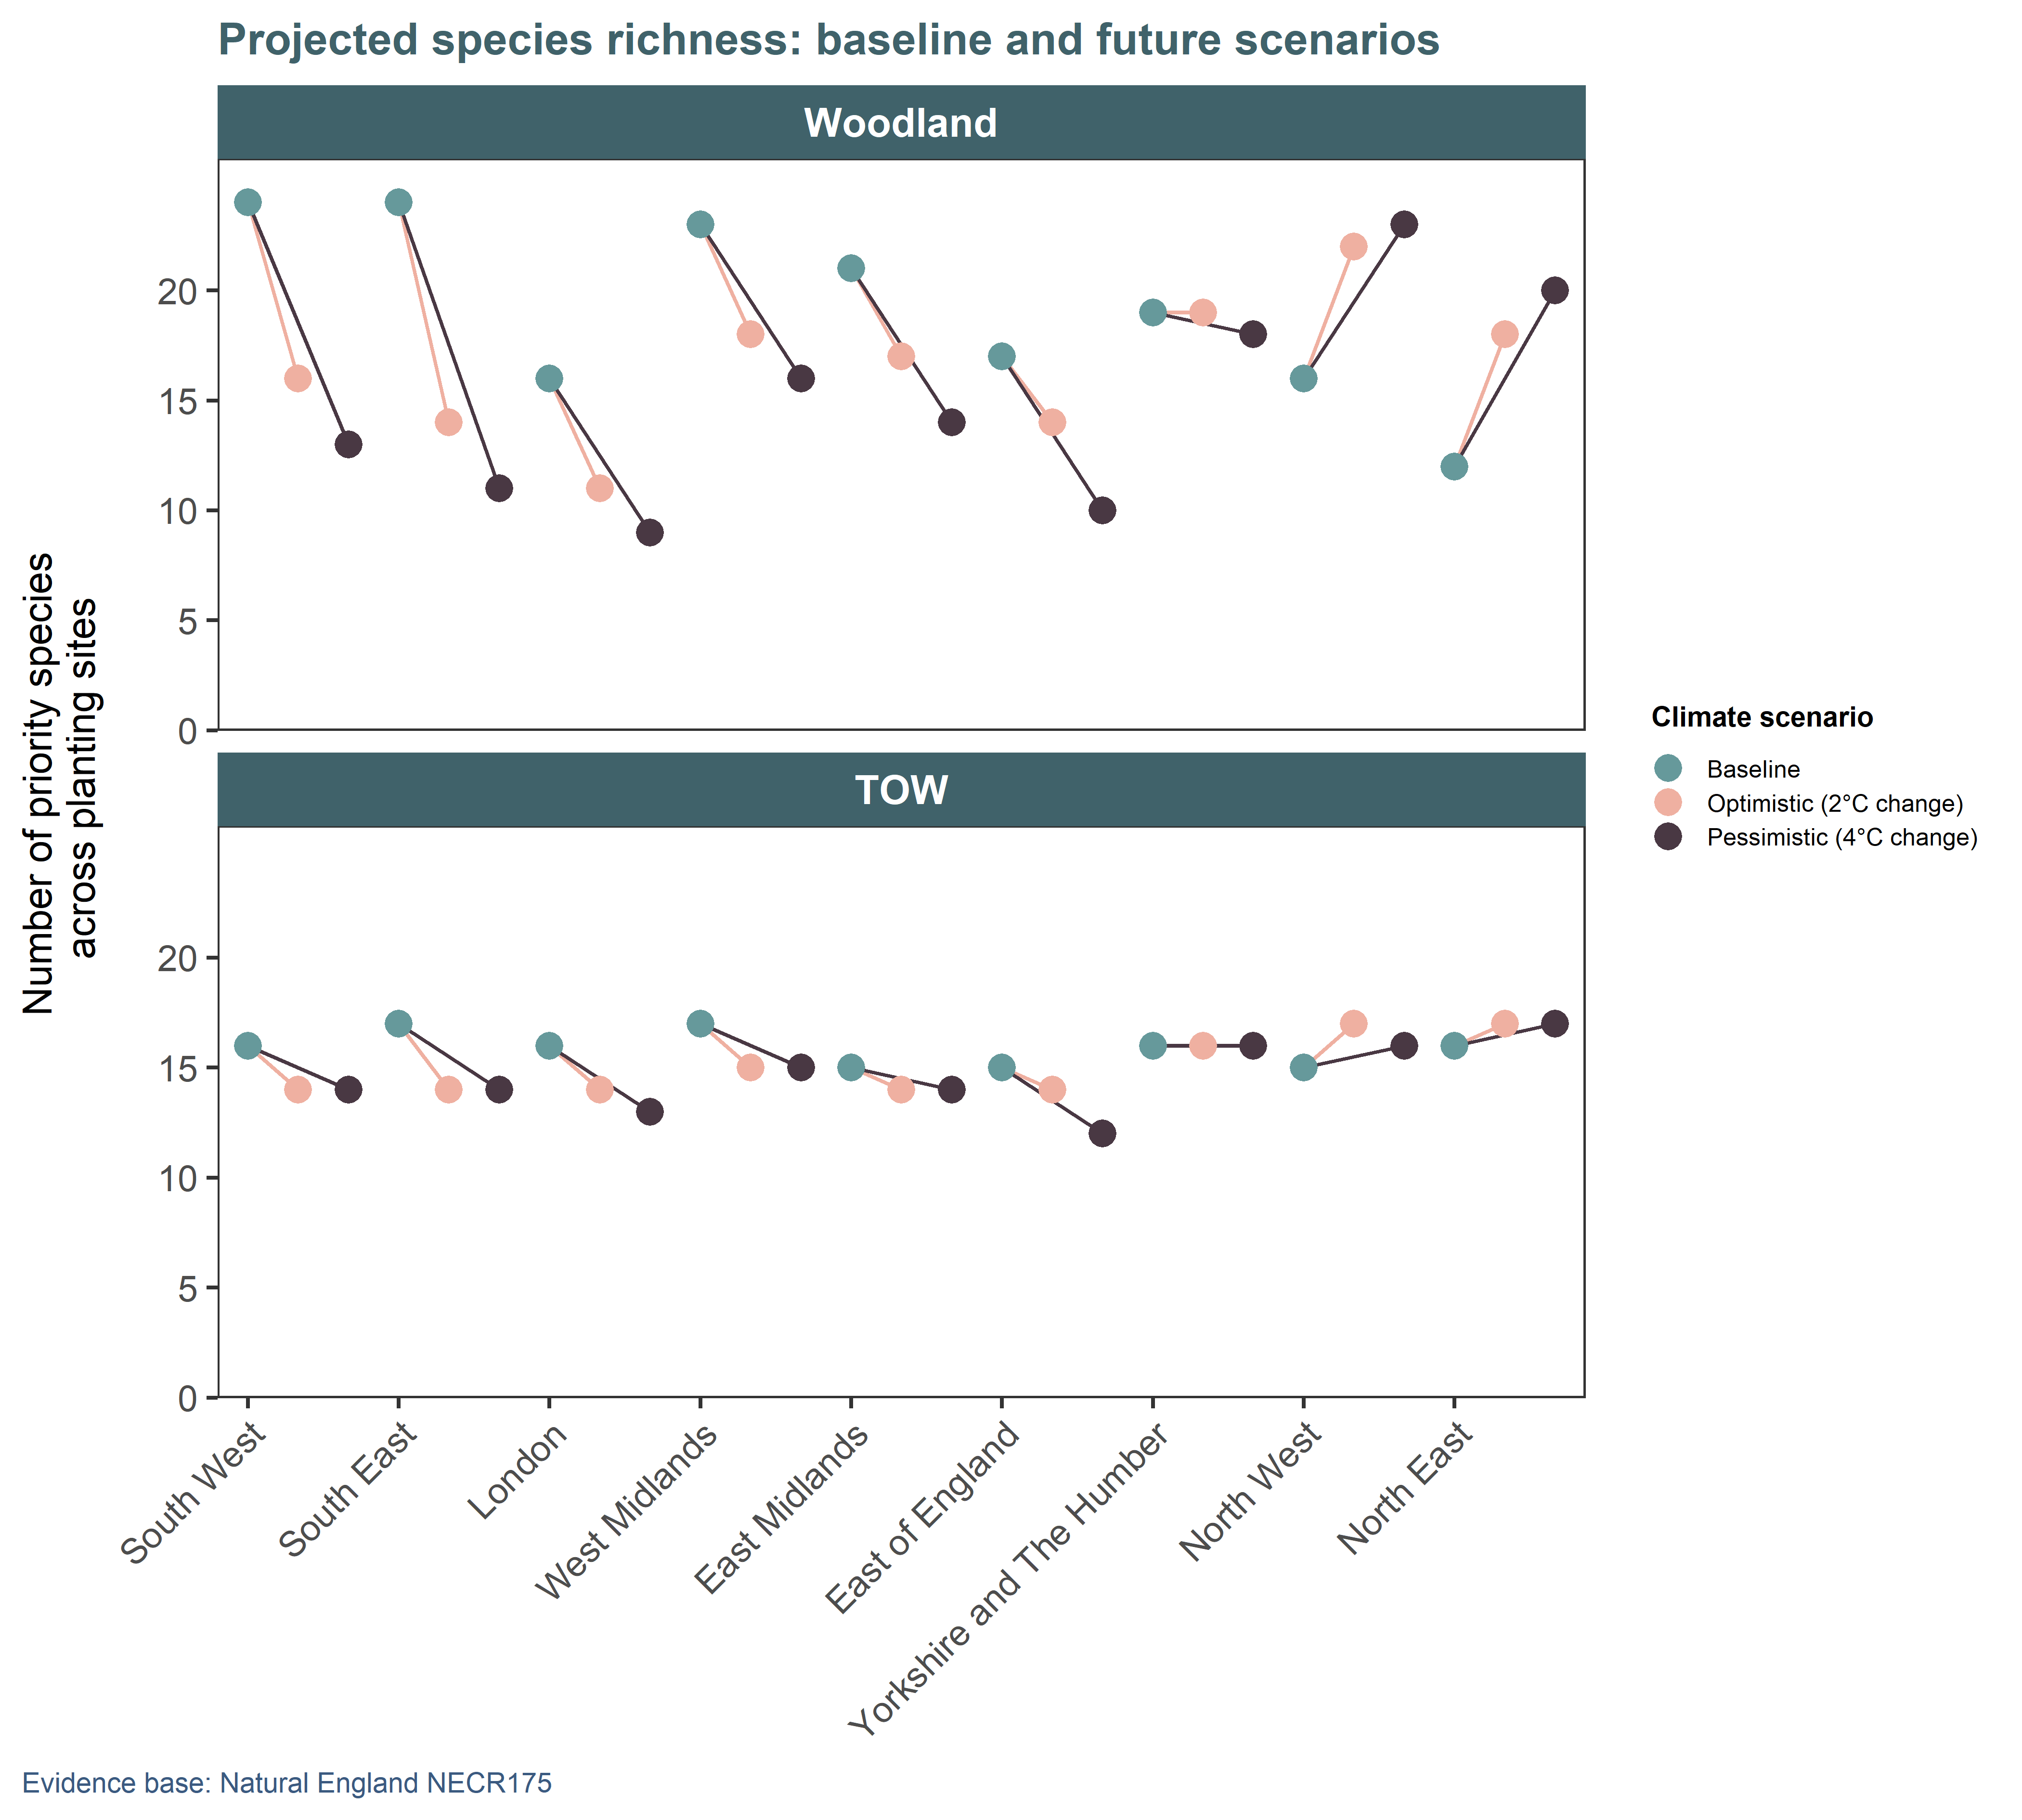
Figure 4.3: Total number of priority plant and bird species associated with woodland and TOW habitats whose climatic ranges intersect NCF planting sites in each region of England under baseline climates (1961–1990) and two future climate scenarios (2070–2099): an ‘optimistic’ scenario (B1) and a more ‘pessimistic’ scenario (A1B) from UKCP09. The original climate suitability maps for each species were taken from Critchlow et al. (2022).
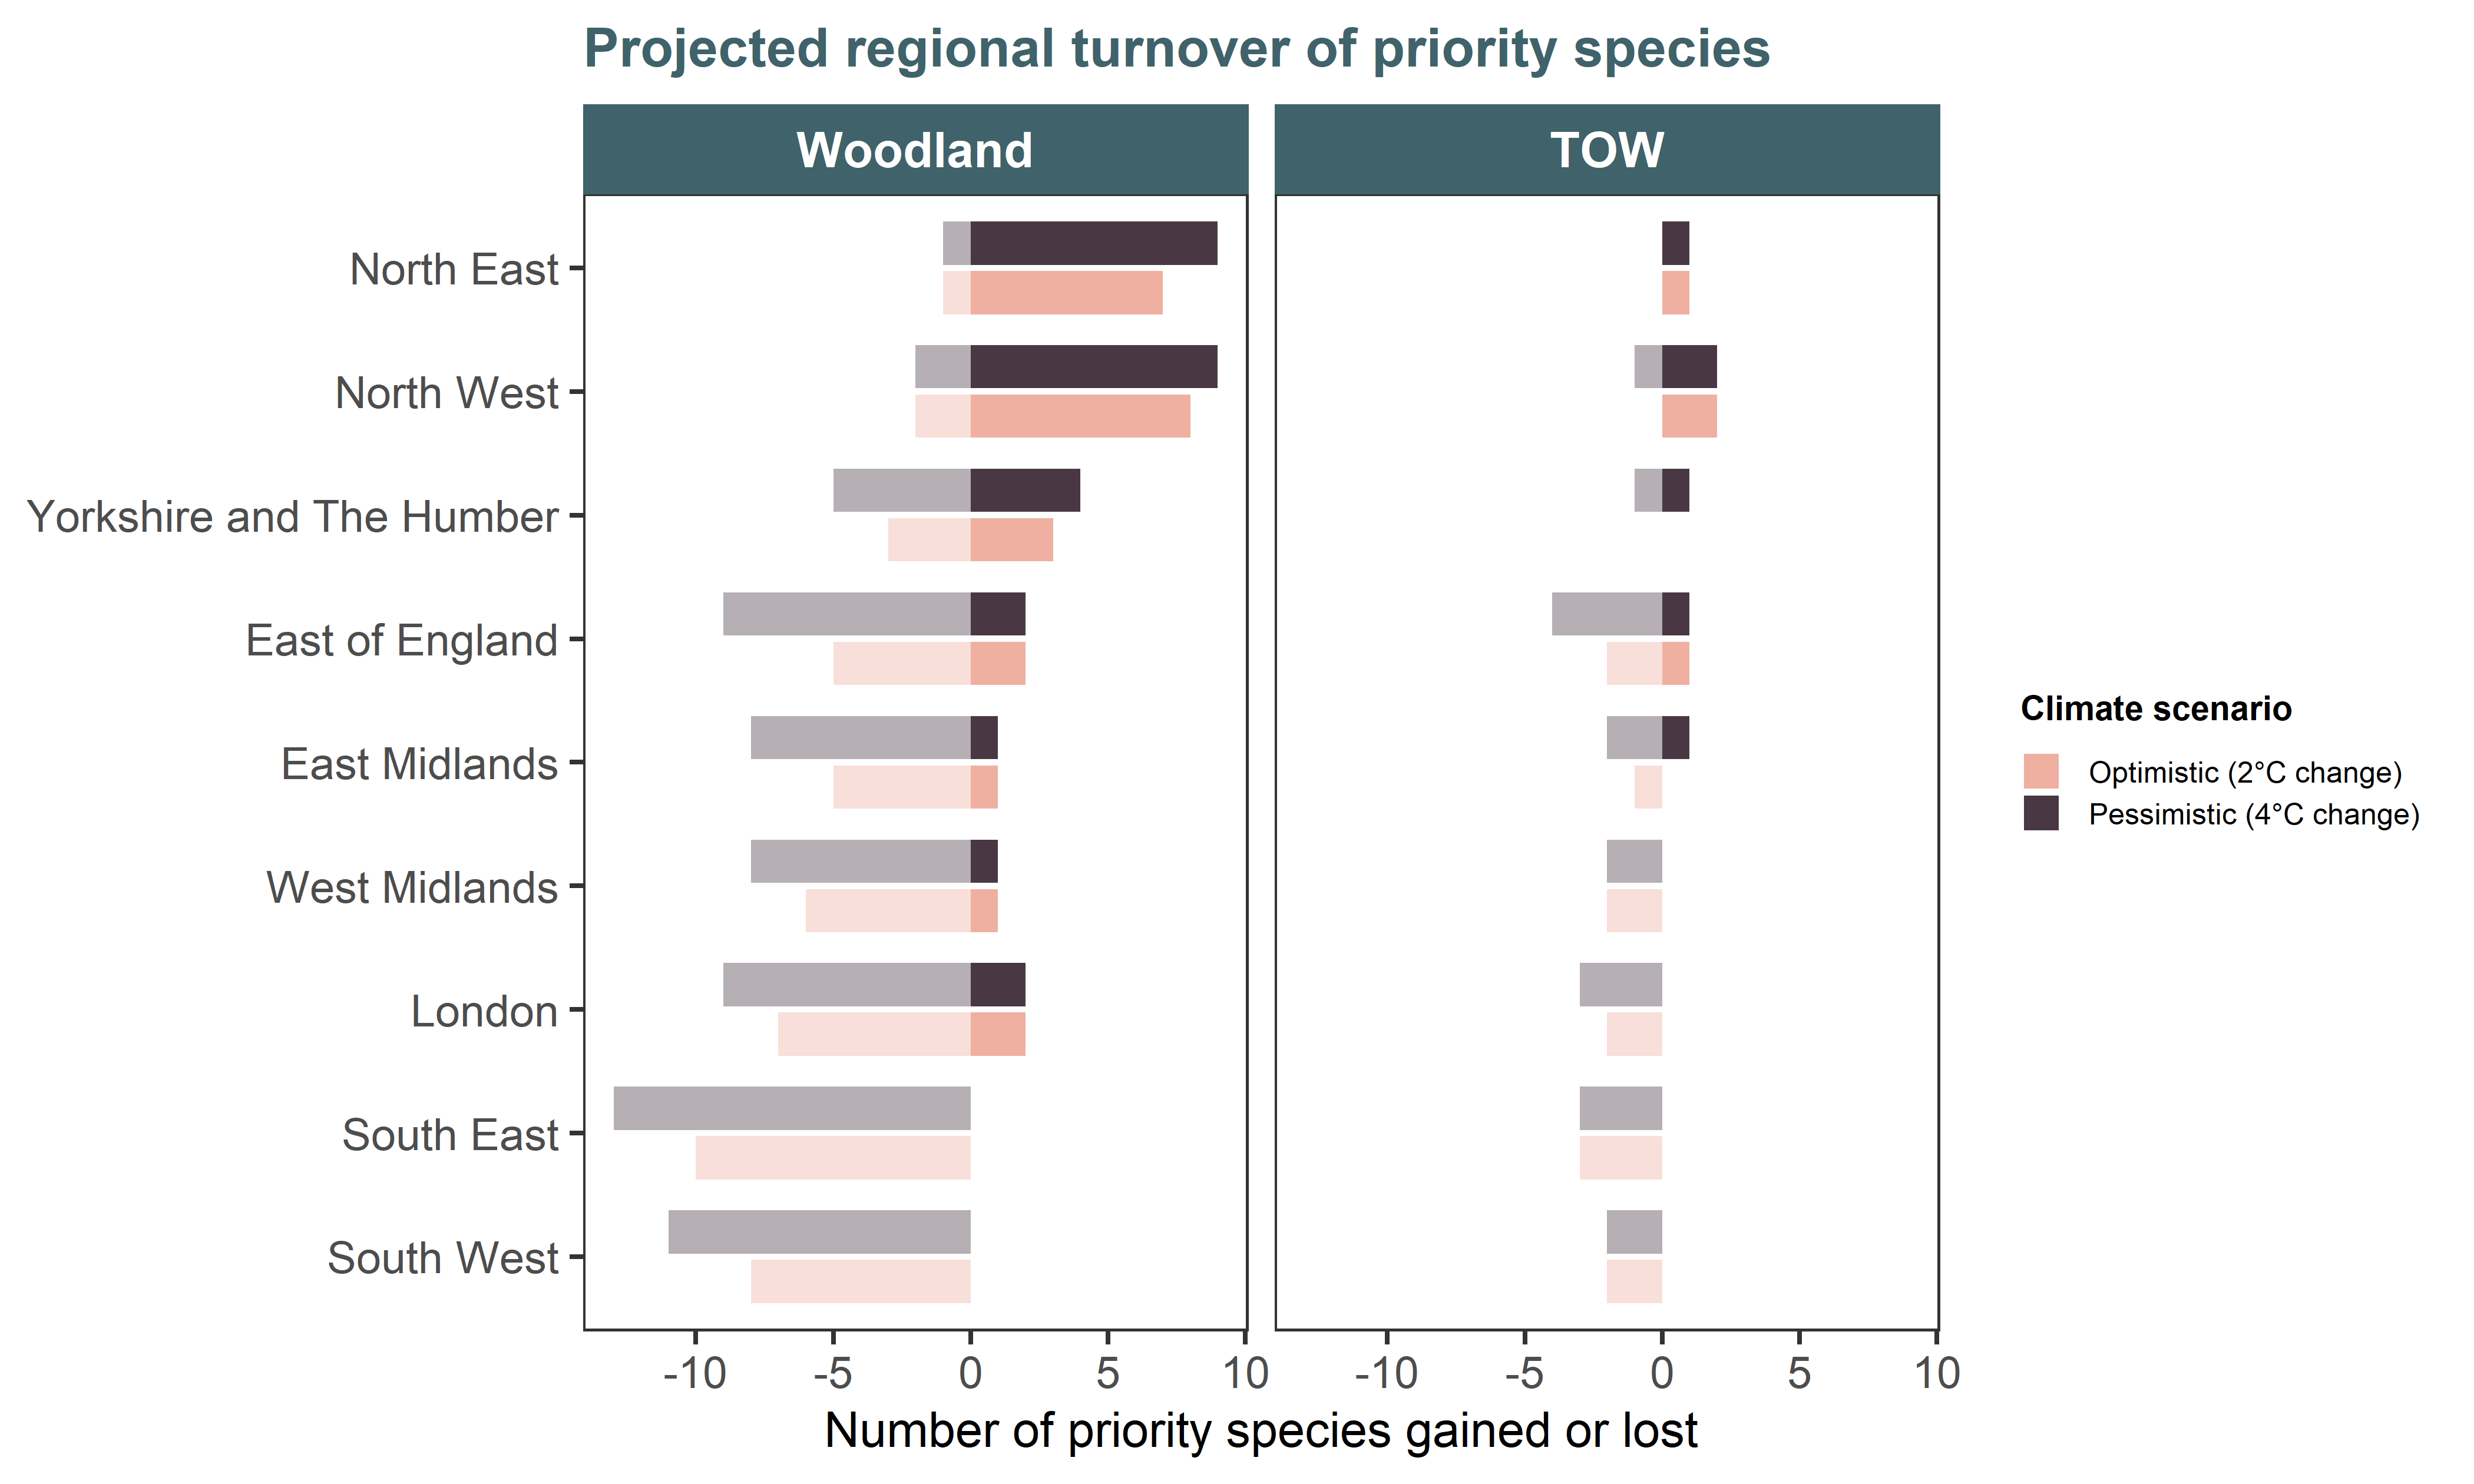
Figure 4.4: The number of priority woodland and TOW bird and plant species gained or lost from each region in England under two climate change scenarios: an ‘Optimistic’ scenario (B1) and a more ‘Pessimistic’ scenario (A1B) from the UKCP09. Gains and losses are estimated by calculating the number of species with climatic ranges that intersect NCF planting sites in each region between baseline climate conditions (1961–1990) and future conditions (2070–2099). The original climate suitability maps for each species were taken from Critchlow et al. (2022).
4.4 Approach and assumptions
4.4.1 Habitat connectivity
The analysis of connectivity considers species traits, such as habitat preference and dispersal ability, and models how these interact with the configuration of the landscape. Ecological networks delineate interconnected areas within which species can disperse: they consist of primary habitat patches interspersed with non-habitats that are not barriers to species movement.
Ecological network mapping has been widely applied across the UK by conservation agencies, and can be modelled spatially using various software: we used EcoservR (Winn, Bellamy, and Fisher 2018). The analysis employed a generic focal species approach, where dispersal parameters and habitat size requirements from the scientific literature are assumed representative of an “average” species for the habitat of interest. We ran the woodland and grassland ecological network with three different sensitivities (Table 4.2) to represent more or less dispersive species.
Network sensitivity | Dispersal (m) | Min. habitat size (ha) |
|---|---|---|
short | 150.00 | 0.10 |
medium | 1,000.00 | 0.10 |
long | 1,500.00 | 0.10 |
The computation of the networks revolves around a cost-distance analysis, where all habitats in the landscape are assigned a relative cost (see technical report for full table) representing how permeable that habitat is to the passage of the focal species (a low cost of 1 being a fully permeable habitat, and a high cost of 50 being a complete obstacle). We used the detailed habitat baseline (Appendix A) as landcover map for this analysis.
4.4.2 Refugia
The refugia metric uses spatial modelling outputs from two climate change vulnerability assessments commissioned by Natural England (Pearce-Higgins et al. 2015; Critchlow et al. 2022) to evaluate the potential benefits of newly created woodland for priority woodland species. Priority woodland species were identified using Natural England’s Species Evidence Base and classified based on their designation under Section 41 of the Natural Environment and Rural Communities Act 2006 (British Parliament, 2006). Climate suitability maps were obtained for 30 priority woodland plants and birds under a baseline climate period (1961–1990) and two future scenarios (2070–2099): an optimistic projection with 2°C warming by the end of the century and a more pessimistic 4°C warming scenario (see Technical Report for additional detail). These maps, which represent continuous probabilities of occurrence, were converted into binary predictions (1 = Suitable, 0 = Unsuitable) and stacked to generate heatmaps of potential species richness across Great Britain for both baseline and projected future climate conditions.
Assumptions and limitations When calculating species richness and turnover across NCF planting areas, we only considered woodland plant and bird species that are currently of conservation priority in England. However, as climate change reshapes species distributions, additional species, both native and those arriving from continental Europe (Barbet-Massin, Thuiller, and Jiguet 2012), may also benefit from NCF planting. Therefore, the statistics presented in this report represent just a subset of woodland species that could benefit from newly created habitats, and assumes they are able to reach these areas either through natural dispersal or assisted colonisation.
Richness and species turnover estimates can be sensitive to the method used for binary conversion of continuous probabilities of occurrence (Liu et al. 2005). Consequently, to test the sensitivity of the main results — derived using a binarization method that maximises classification accuracy (see Technical Report) — we compared them with the set-threshold approach used in the original study (Critchlow et al. 2022). The projected trends in richness, gains and losses were consistent across the methods of binarization, with higher predicted richness in the Pennines and Lake District, but the set-threshold approach tended to predict the presence of a larger number of species (Appendix C). This outcome was expected due to the low threshold (0.01) used for conversion, which is likely less realistic (Liu et al. 2005; Liu, White, and Newell 2013) than other more objective methods such as the one adopted in the present study.