Chapter 3 Carbon Sequestration
3.1 Indicator definition
The Earth has been experiencing planetary warming at an unprecedented rate over the past half century, driven by human activities (Intergovernmental Panel on Climate Change (IPCC) 2023). Under current trends, we can expect around 3°C of warming by 2100 (Intergovernmental Panel on Climate Change (IPCC) 2023), likely to have profound effects on human society and biodiversity (Dı́az et al. 2019). To keep warming below 3°C, there has been a recent push to attain net zero carbon emissions in many countries, including the UK (UK Government 2019).
This indicator measures the amount of CO2 sequestered (or emitted) by habitats in an area of interest. Applied to woodland, it uses the calculations behind the Woodland Carbon Code (WCC 2025), taking in information on species, yield class, management and spacing as well as site characteristics (soil type and level of disturbance). The output is a time-series of predicted net sequestration by woodland, allowing for potential losses (emissions) at establishment from soil disturbance.
To quantify sequestration by trees outside woodland and baseline carbon sequestration (pre-planting habitats), we used data compiled in an evidence review (Gregg et al. 2021). The report is a comprehensive literature review collating published rates of carbon sequestration or emission from a wide range of land cover and land use types.
3.2 Key results
NCF planting is expected to sequester an additional 2.2 to 2.4 million tonnes of CO2 by 2050, compared to the previous habitats at the planting locations (Figure 3.1). This is roughly equivalent to the emissions produced by 138,100 cars5 over their lifetime. The carbon balance is initially expected to be negative due to emissions at establishment (e.g. from soil disturbance) and the loss of CO2 uptake from any replaced semi-natural habitats. Net sequestration is expected to begin between 2026 and 2031. Woodland planting accounts for 91% of the projected sequestration, and trees outside woodland for 9%.
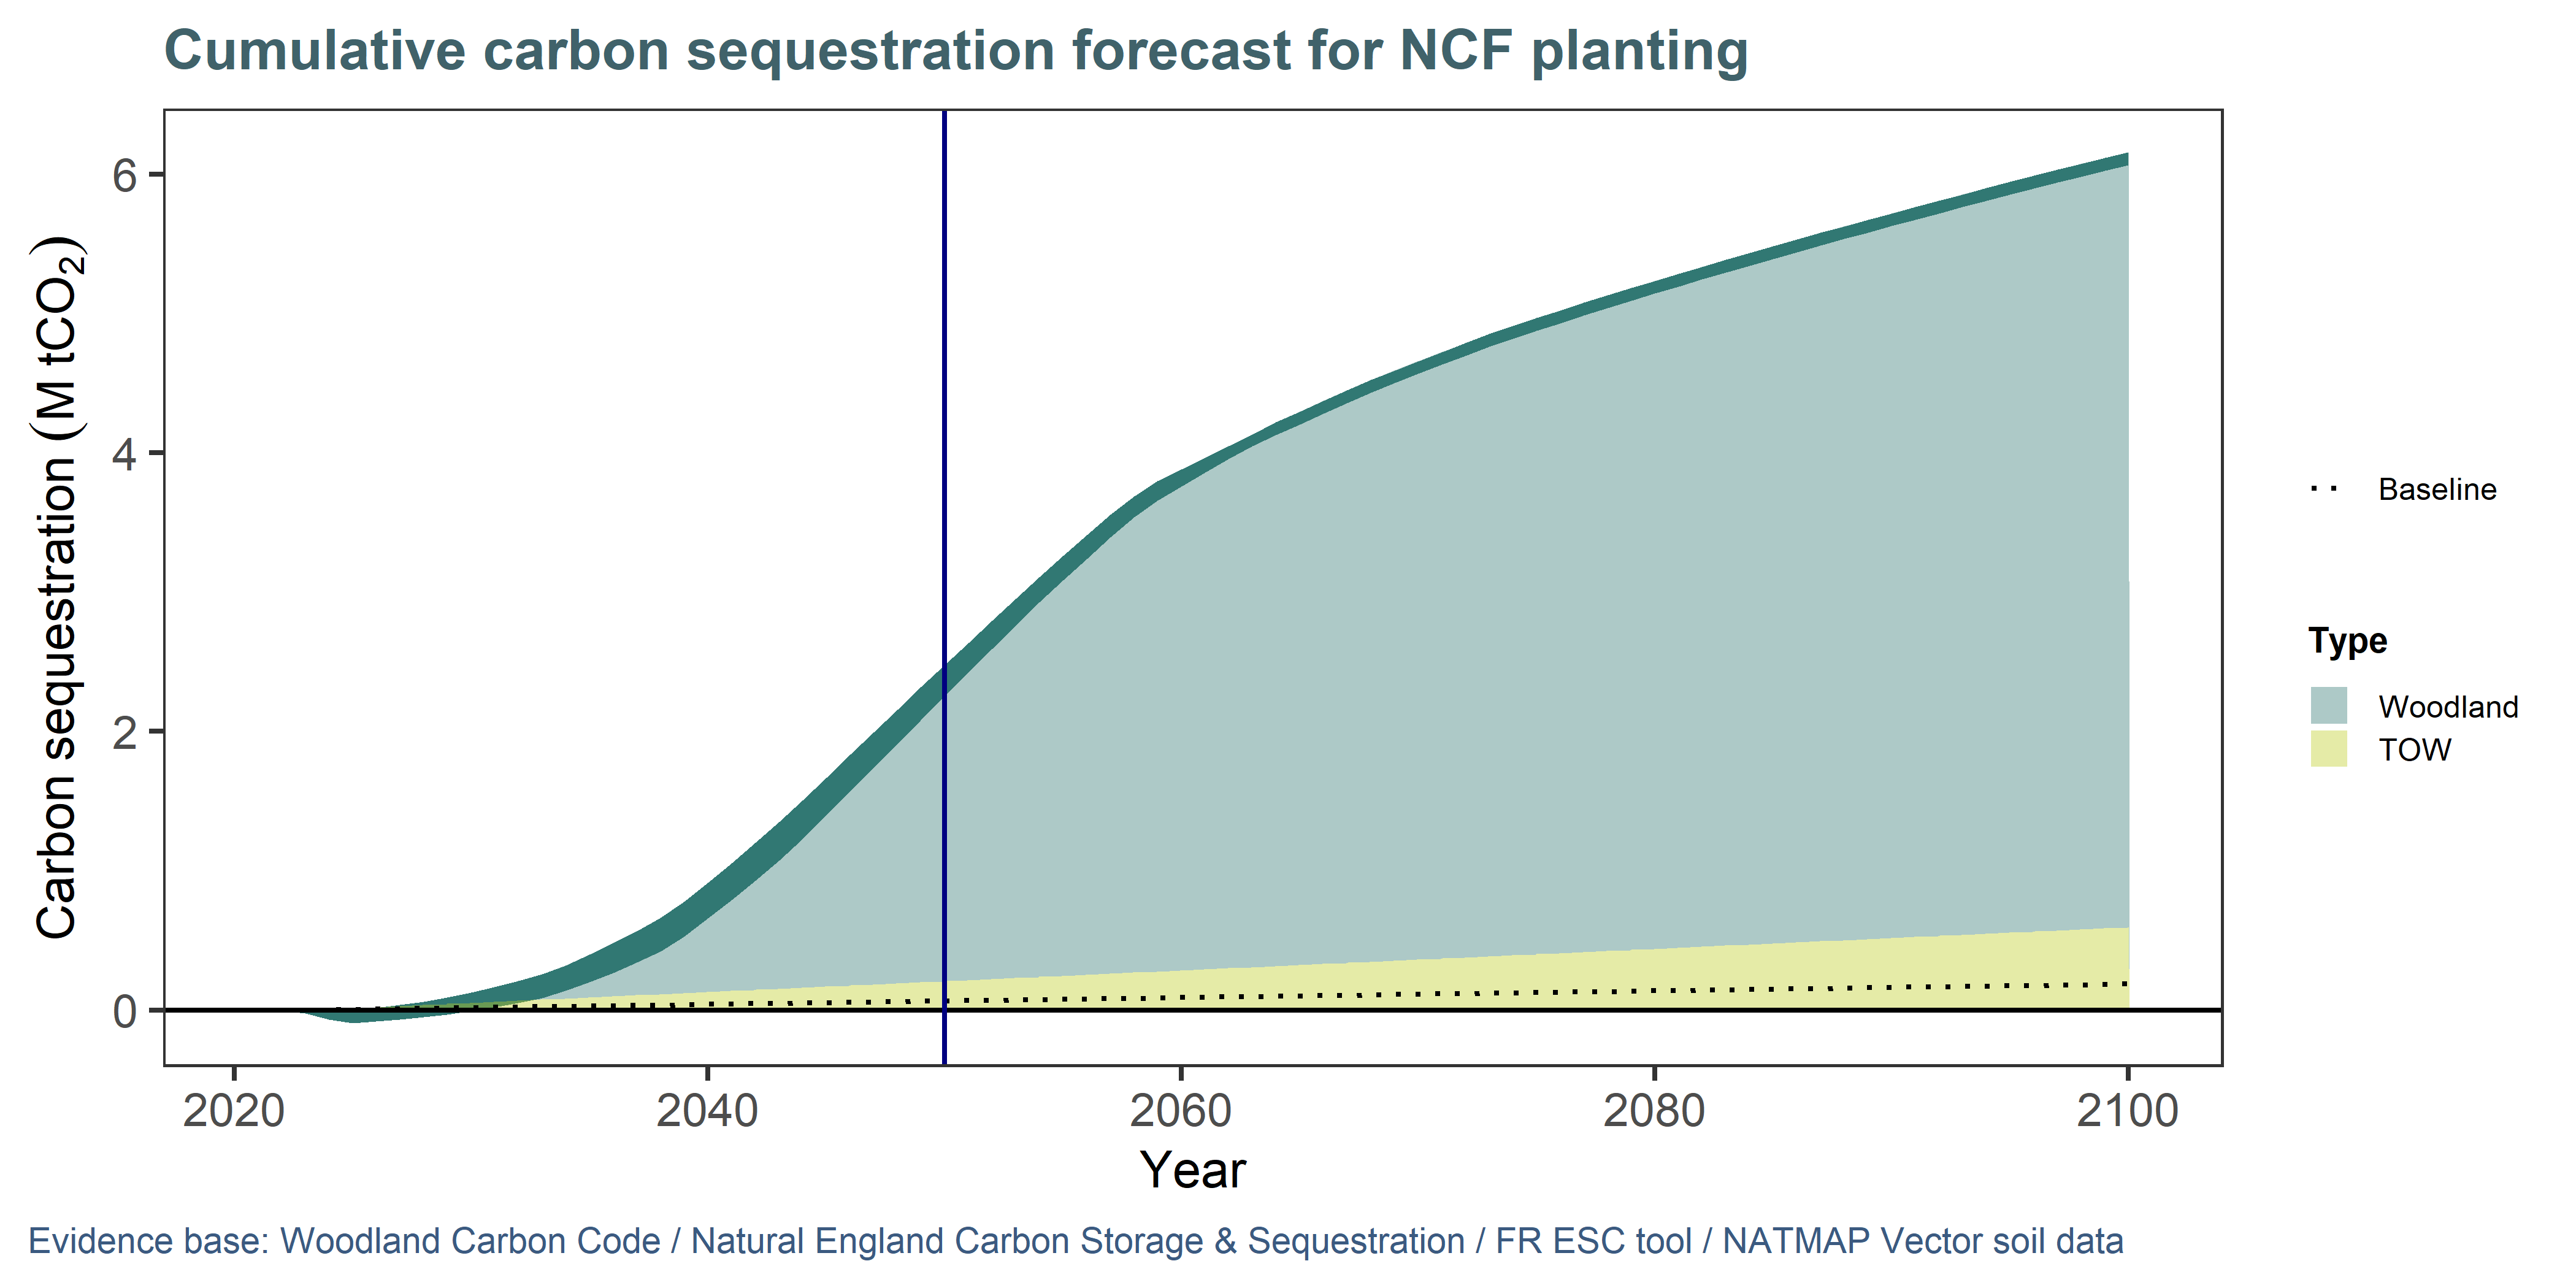
Figure 3.1: NCF planting (incl. Woodland and Trees Outside Woodland) are expected to sequester over 1 million more tonnes of CO2 by 2050 than the habitats they replaced (dotted line). The darker ribbon indicates the likely predicted range, based on 12 scenarios where we varied disturbance, spacing and management parameters to reflect uncertainty (see Approach and assumptions).
Carbon sequestration by trees depends, among other factors, on how well species can grow given the soil, local climate and other conditions at the site where they are planted. Even within species, seed provenance can affect performance, and management also plays a role. We could not build all these factors into the indicator, but our analysis considers the role of soils (using the National Soil Map) and species (using model species as site information was not available). We modelled a range of scenarios for management and disturbance to provide a range of estimates. Finally, the model uses a climate projection scenario to assess the yield class (a measure of tree productivity) of species at planting locations (see approach for details), and this is the key factor responsible for spatial variation in the outcomes.
The effectiveness of NCF sites to capture CO2 is projected to be highest in the North West (Figure 3.2). This can be explained in part by the relatively high proportion of woodland vs TOW in this region (dense stands will capture more per hectare than sparse tree cover), but also because the planting locations in this region are set to experience the greatest increase in yield class by 2050 (not shown; data extracted from Forest Research’s Ecological Site Classification Tool).
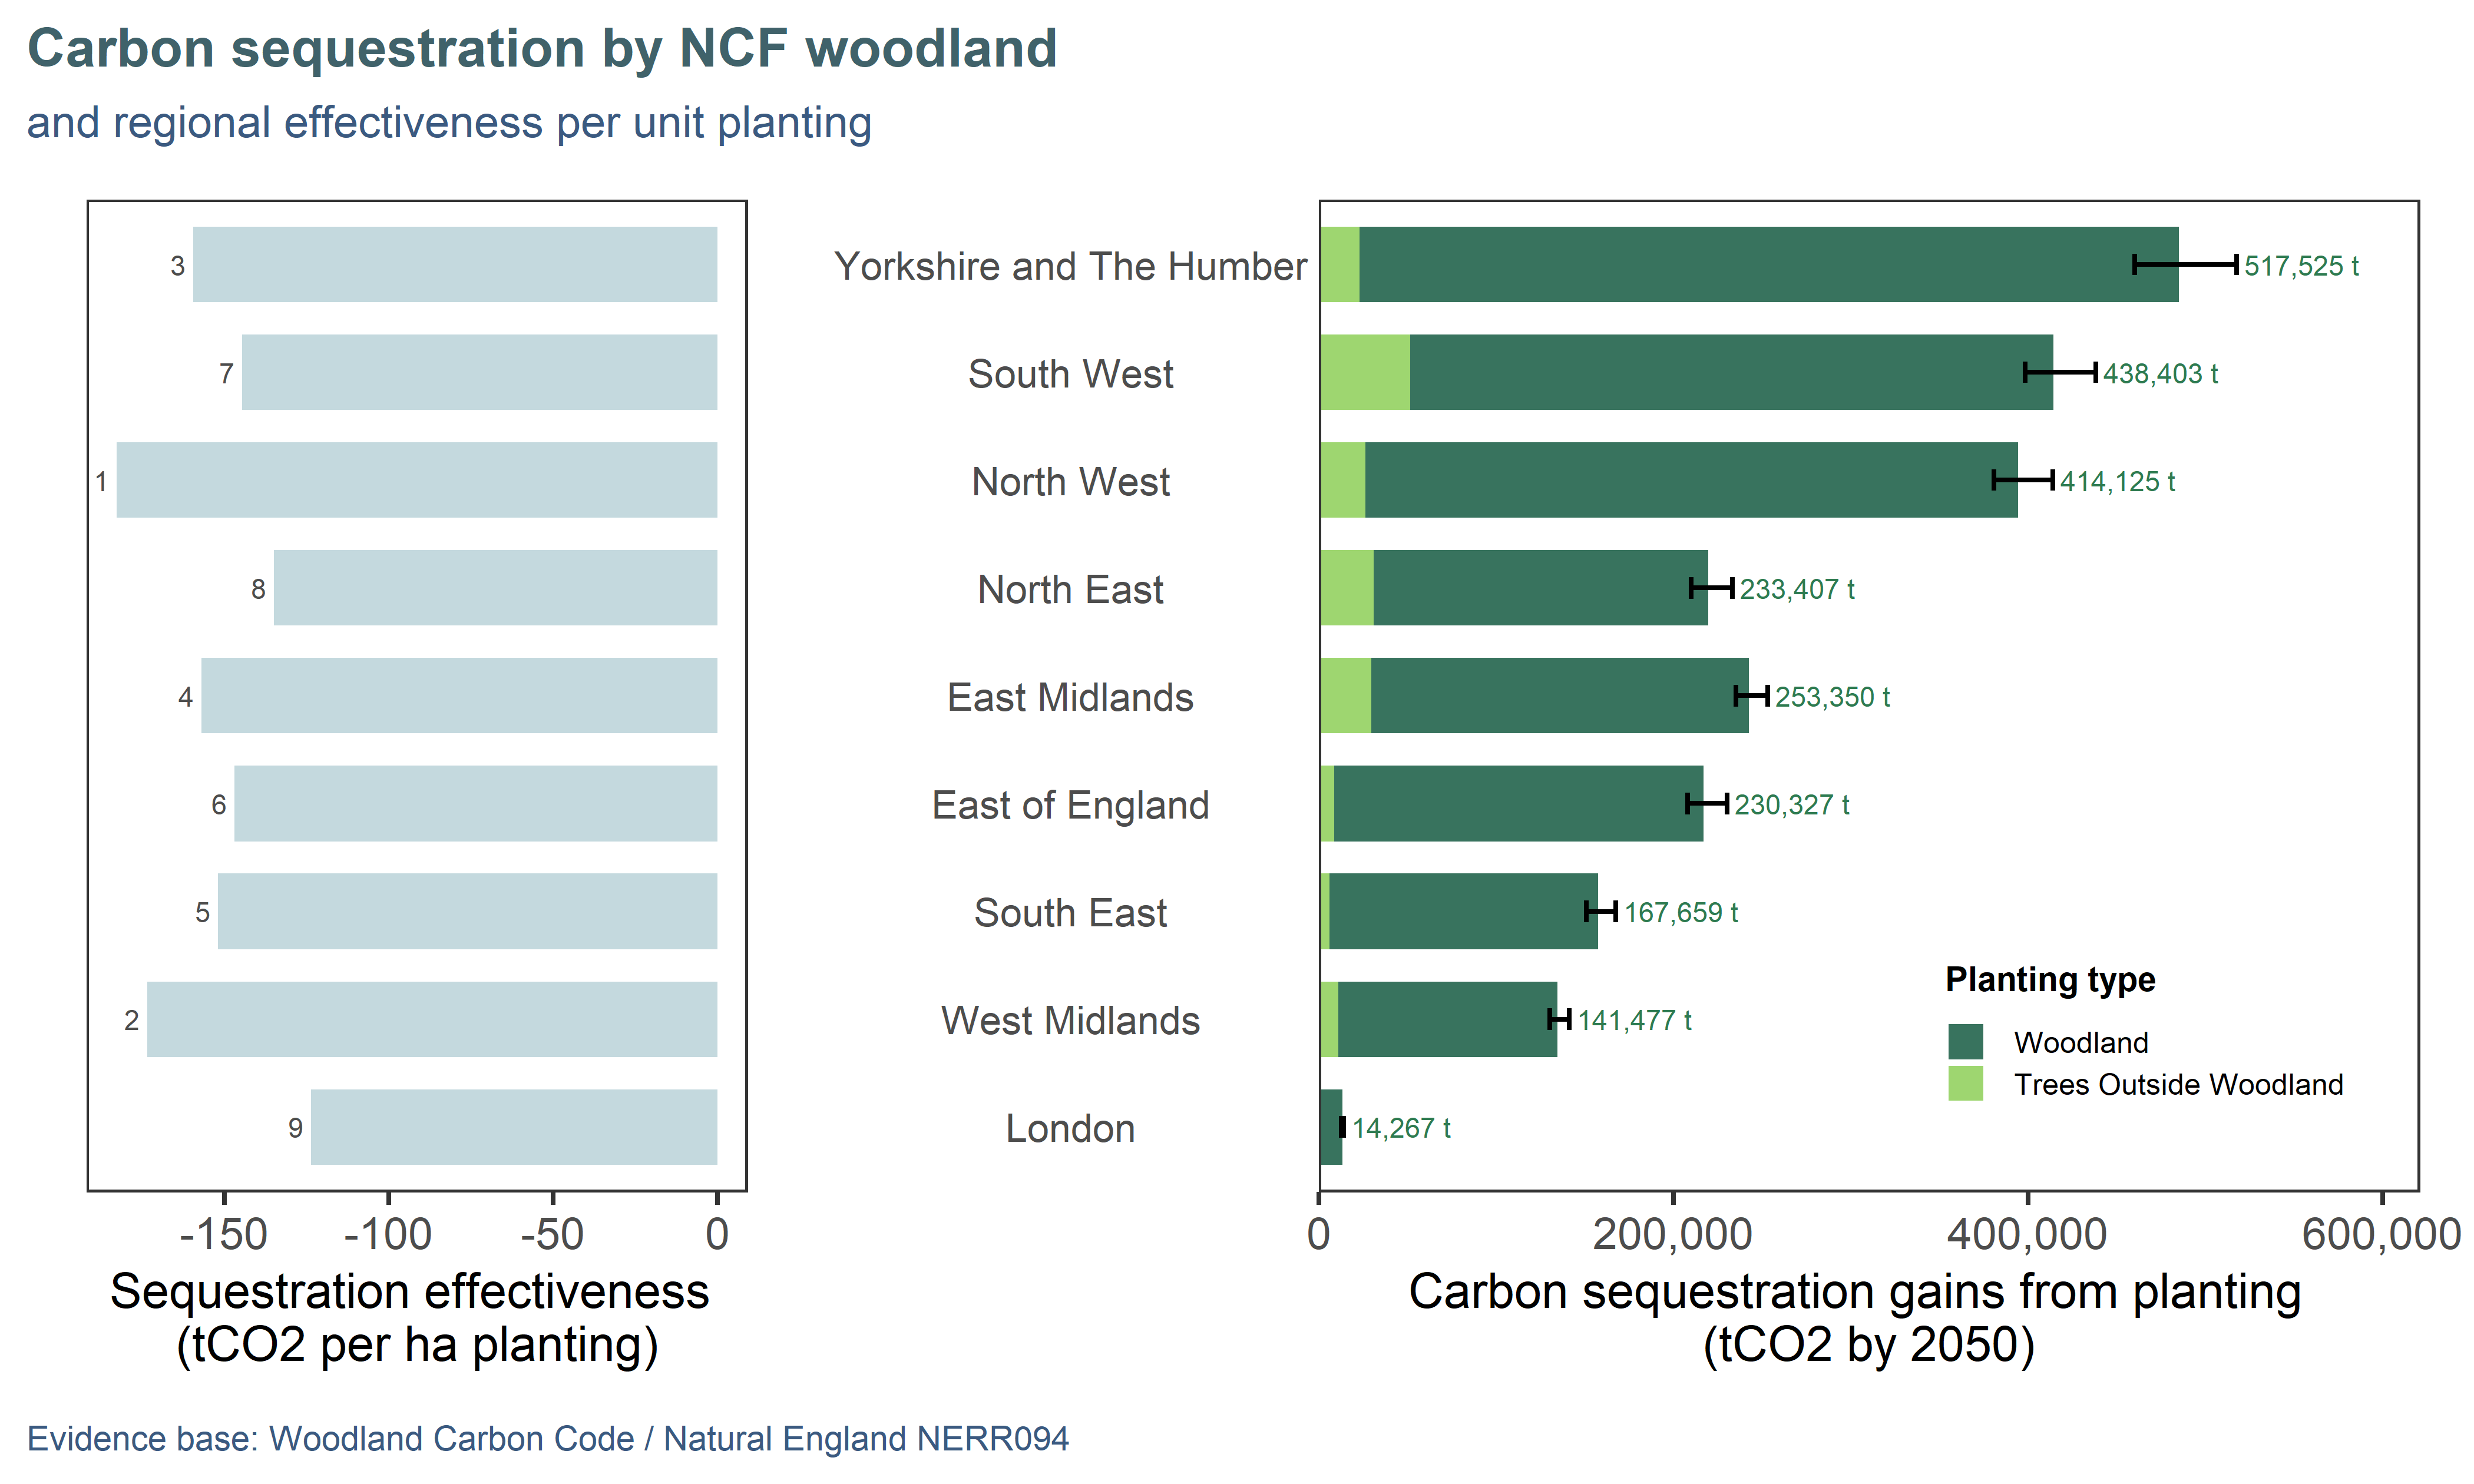
Figure 3.2: Projected cumulative sequestration (by 2050) by NCF planting compared to previous land use. Regions are ordered top-down by decreasing area of planting: total sequestration (right) and effectiveness (left; sequestration per hectare of planting) are affected by growing conditions impacting the yield class of trees. Effectiveness ranking is annotated on the left panel, 1 being the best.
3.3 Approach and assumptions
Woodland creation sites were assessed using the Woodland Carbon Code (WCC 2025), a recognised standard to assess carbon sequestration from trees. This is one of the approaches recommended by the Enabling a Natural Capital Approach (ENCA) service databook (DEFRA 2025b). We wrote the WCC carbon calculations into an automated model which can be run on spatial data, allowing us to assess all the sites efficiently. However, the WCC requires a lot of detailed information which is not always available, so we had to use a number of default assumptions described here.
Species-level data was typically not provided by planting partners, and where available was not in consistent formats (PDF lists, spreadsheets, etc). For simplicity, we assumed an equal split of the WCC model species SAB (sycamore-ash-birch), BE (beech) and OK (oak). These cover over 30 commonly planted species and were deemed representative of NCF planting.
A key factor affecting carbon estimates is the yield class, a measure of the productivity of a given species in a given location. This was not routinely available from the planting partners, so our model automatically queried the Ecological Site Classification (ESC) Tool (Forest Research 2024) for yield class of all modelled species for each planting location, and assigned a representative (median) yield class to each NCF site. We used the ESC “Medium-High 2050(A1b 3q0/AWC)” projection of future yield class as advised by the WCC guidance (WCC 2025). This accounts for climate change effects on tree growth and is more likely to be representative of conditions that the young trees will experience in the future.
Tree spacing, management (thinning or not) and disturbance levels (site preparation) information was not available for NCF sites, so we ran 12 scenarios to get bracketed estimates of sequestration likely to capture the uncertainty arising from these parameters. We modelled the following combinations of attributes:
- Disturbance level: Low or Medium. From discussions with NCF partners, ground preparation and disturbance seemed relatively benign in most cases.
- Spacing: Close / Medium / Wide. We assigned our model species the minimum, middle and maximum spacing values available from the WCC lookup tables.
- Management: Thinning or No thinning.
Finally, we intersected the planting data with the habitat baseline and with soil data (Cranfield University 2001) to obtain the combination of previous land use and soil type proportions for each site. This information is used to estimate loss of carbon through soil disturbance.
For non-woodland schemes (agroforestry, urban trees) and other baseline habitats, we used data compiled in an evidence review (Gregg et al. 2021) which also comes recommended by ENCA (DEFRA 2025b). The report is a comprehensive literature review collating published rates of carbon sequestration or emission from a wide range of land cover and land use types.
Our calculations only consider uptake of CO2 by living trees: we did not adjust values for the durability of the storage (permanence), which could be impacted by natural factors such as disease and mortality, or by land-use factors such as harvesting.
References
Assuming an average car emits 125 g CO2/km, travels 11,000 km per year and has a lifespan of 14 years.↩︎