Chapter 6 Flood Risk Mitigation
6.1 Indicator definition
It is estimated that between 2016 and 2019, floods caused around £708 million’s worth of economic damage in England and Wales (Environment Agency 2021b). Due to recent increases in flood-related losses and the high construction and maintenance costs associated with traditional flood defences, there has been a growing emphasis on nature-based solutions for natural flood management (NFM) (Cooper et al. 2021).
This indicator measures the volume of water removed or slowed down by NCF planting. Strategic woodland creation in high-risk catchments is one approach to NFM, as woodland and trees regulate flood risk in downstream communities in several ways (Nisbet 2022):
- Canopy interception: leaves and branches catch rainfall, slowing down and reducing the amount of water that reaches the ground during storm events;
- Water use: trees take up water through their roots, using it for biological processes and evaporating some of it back to the atmosphere. This usually leaves capacity for the ground to store more water. Forest soils are also typically less compacted and allow better infiltration;
- Physical barrier: in floodplains, trees and woody debris can create obstacles that slow the flow and temporarily hold back flood water.
This indicator built upon published values from a Forest Research study (Broadmeadow et al. 2023), itself the result of a complex analysis which used the Joint UK Land Environment Simulator (JULES) land surface model. JULES considers the mechanisms listed above for woodland water storage, and the study derived storage volumes for woodland (and trees outside woodland) using modelled counterfactuals (e.g. all woodland replaced by grass). We applied the published rates to all NCF planting (woodland and TOW) and to any baseline woodland and trees at the site locations to measure uplift in storage attributable to the programme.
6.2 Key results
NCF planting is projected to retain or slow down, once mature, up to 4.6 Mm3 (millions of cubic meters) of water annually (Table 6.1), contributing to flood risk reduction. This would fill ca. 1,828 Olympic swimming pools every year. The contribution of young trees (shape of the curve) to the flood regulation service is unclear and not well documented in the scientific literature. With assumptions that any flood regulation benefits from young trees are negligible until 5 years old, and that the increase in capacity is then linear until reaching a full, constant potential at 20 years old (informed by expert opinion), a net gain in capacity over baseline habitats could be achieved from 2030. The cumulative storage uplift of NCF against the baseline could be around 68 Mm3 by 2050 (Figure 6.1).
Region | Storage uplift (Mm 3/y) |
|---|---|
Yorkshire and The Humber | 0.99 |
South West | 0.84 |
North West | 0.66 |
East of England | 0.51 |
North East | 0.49 |
East Midlands | 0.47 |
South East | 0.36 |
West Midlands | 0.21 |
London | 0.04 |
Total | 4.57 |
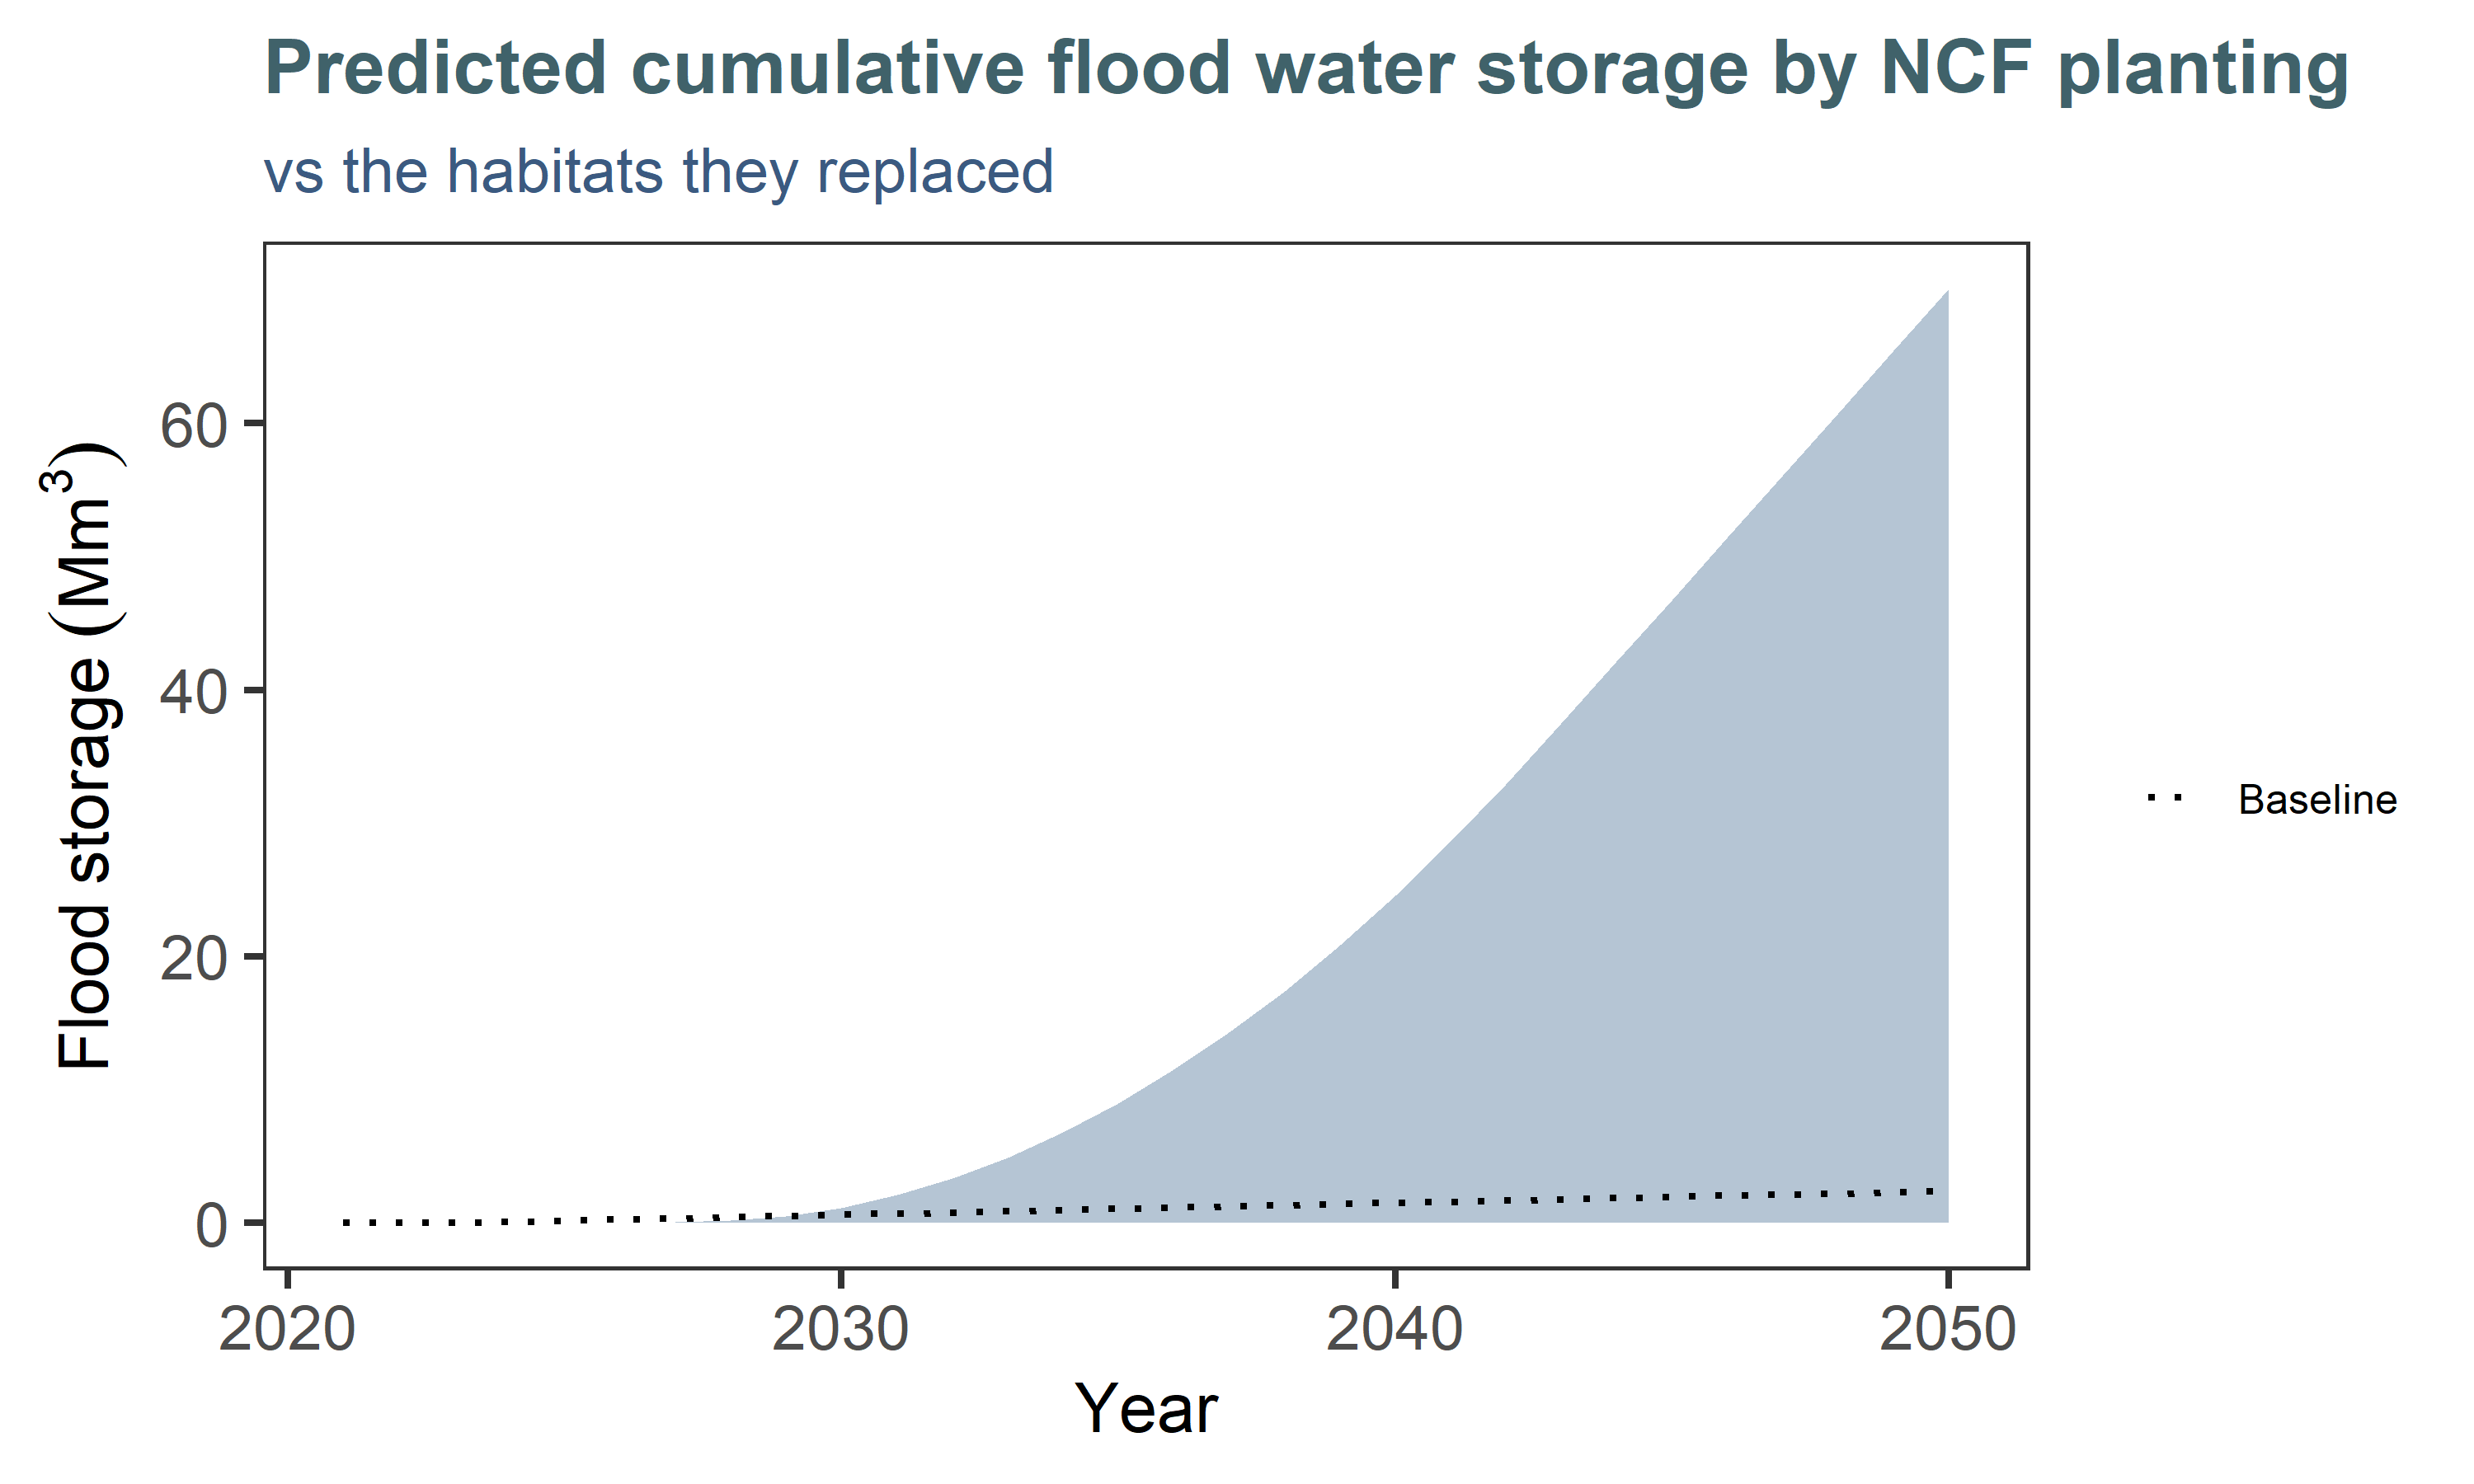
Figure 6.1: Cumulative flood mitigation benefits of NCF planting by 2050, compared to a ‘business as usual’ scenario (dotted line) if previous habitats were left untouched.
There is not a great deal of spatial variation apparent, i.e. the effectiveness of planting is similar across regions (Figure 6.2). This is because there was no evidence available at sub-national level for this indicator (see approach). Slight variations occur because of planting type, and depending on whether there were existing trees in the baseline. Moreover, the indicator recognises planting in the floodplain, which contributes additional storage capacity due to hydraulic roughness. We used the Environment Agency’s Flood Map for Planning (Flood Zone 2) (Environment Agency 2025a) to identify sites located in the floodplain (Broadmeadow et al. 2023).
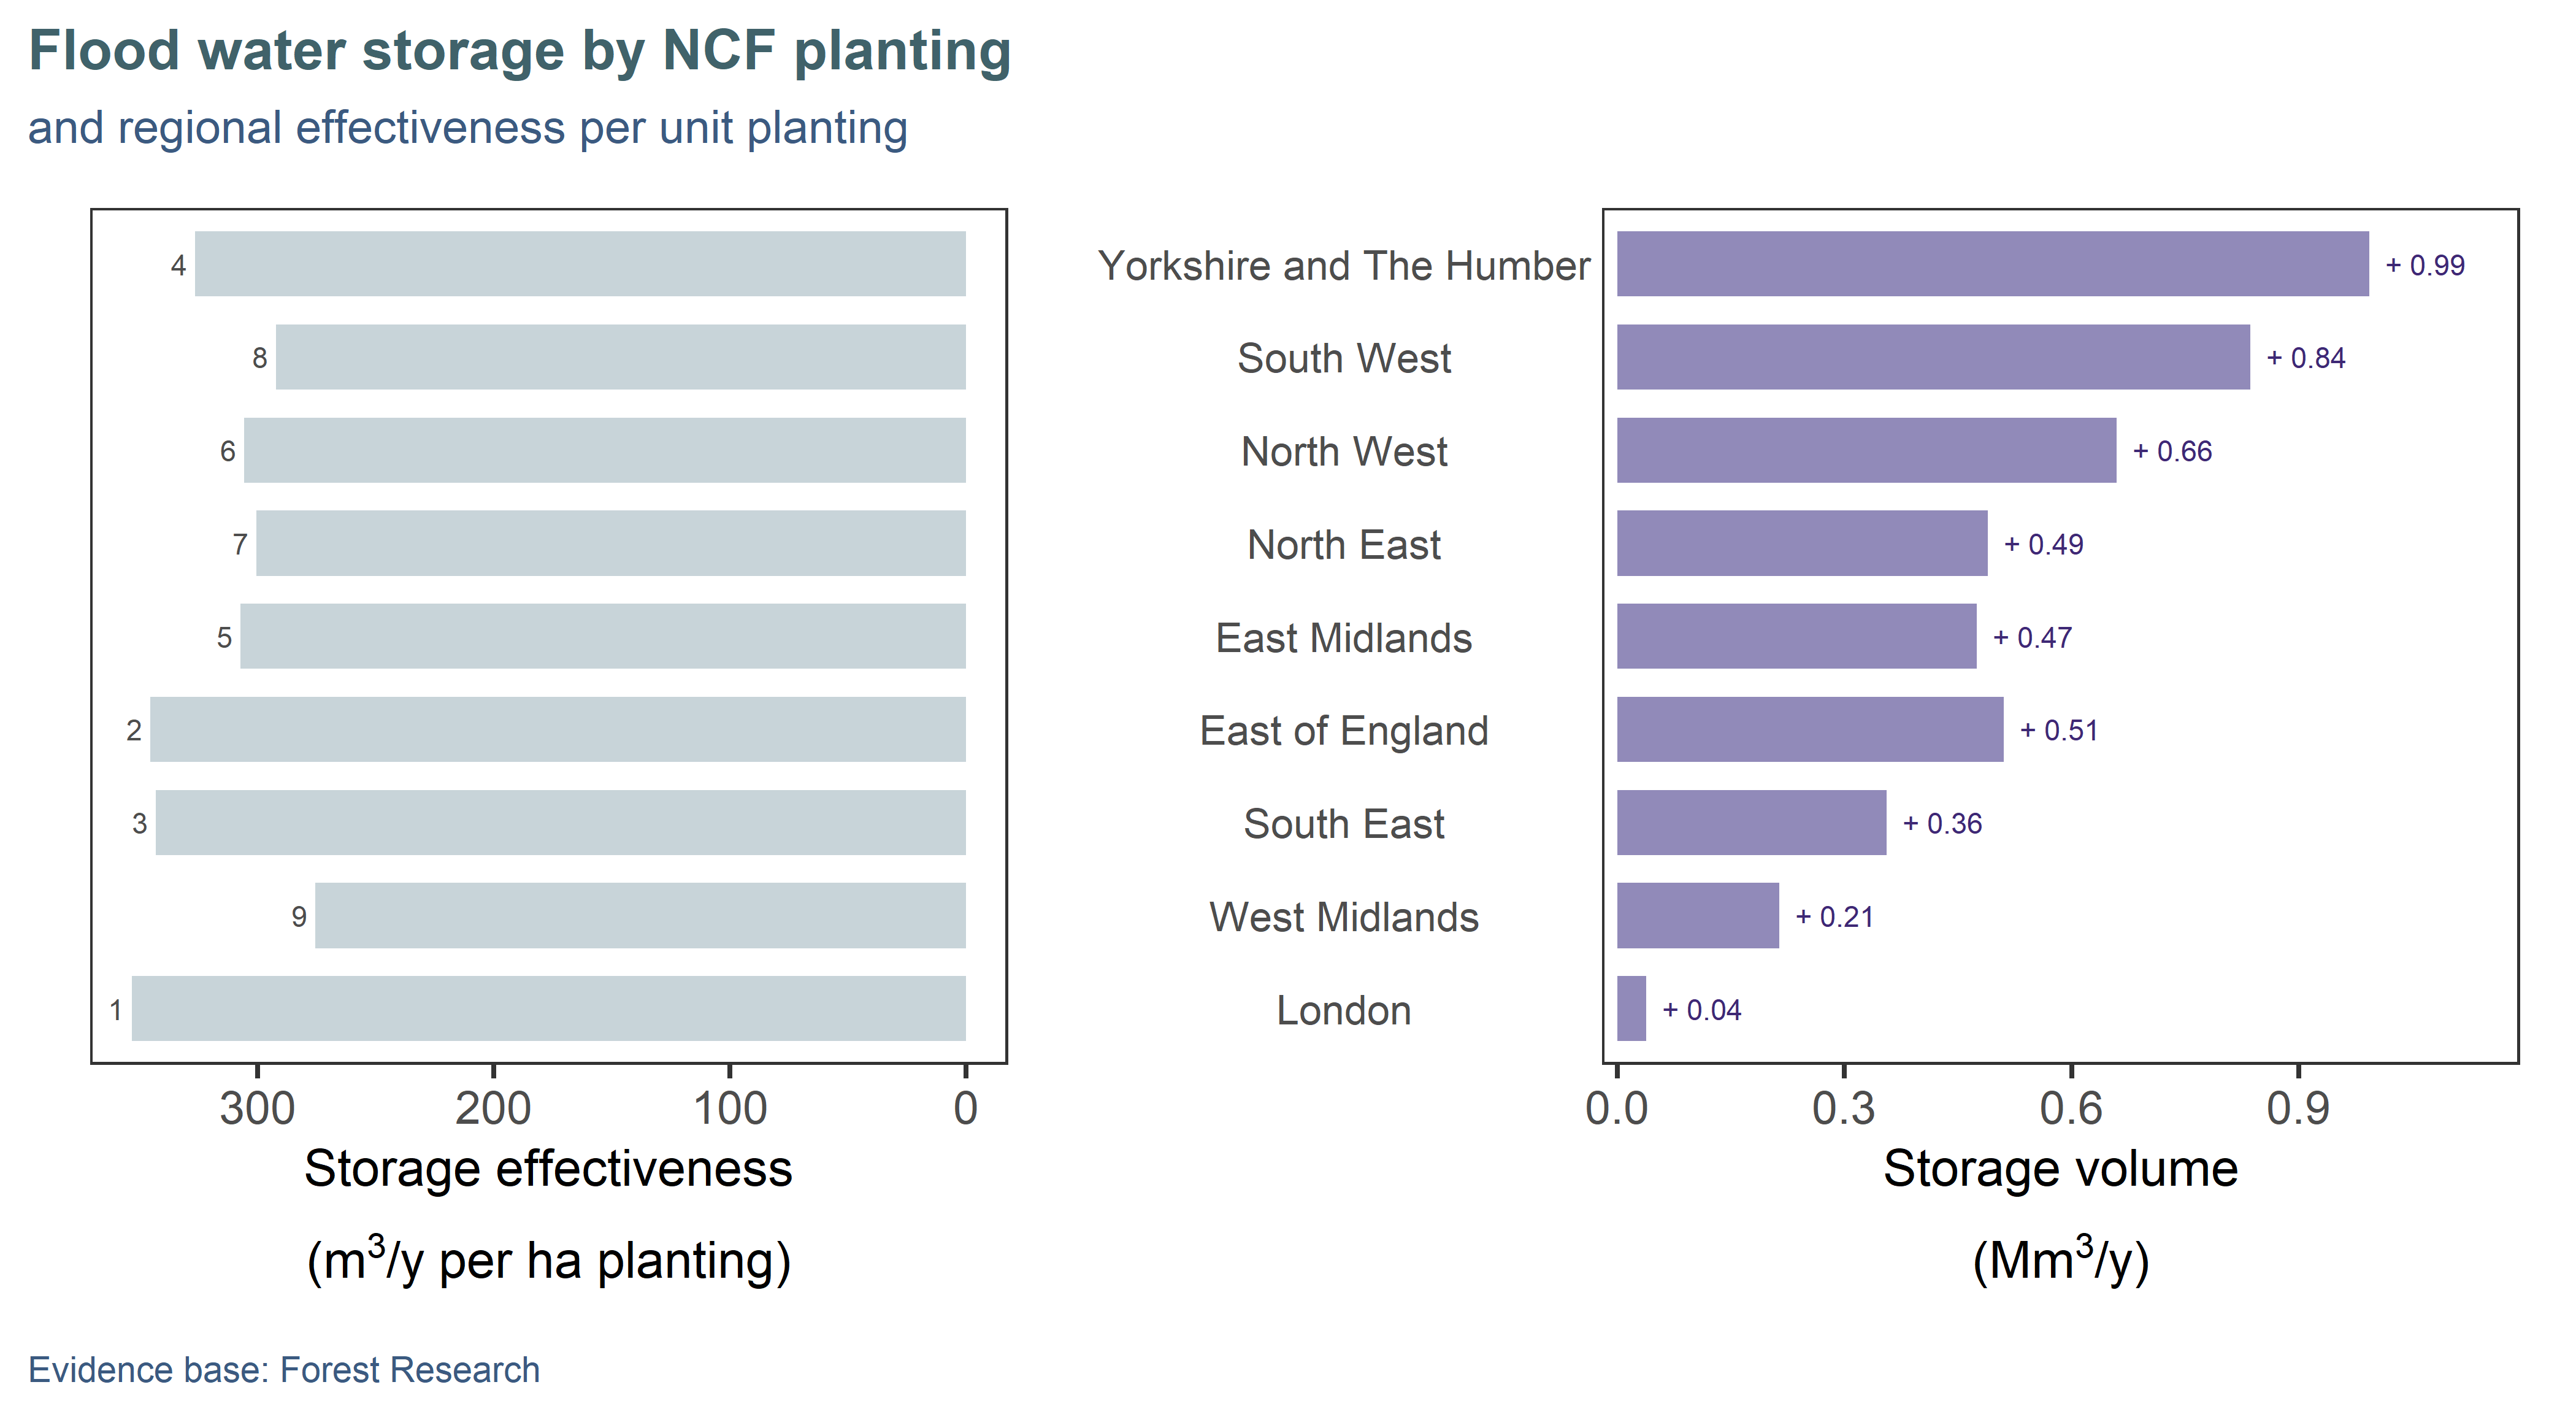
Figure 6.2: Regional annual contribution (right) of NCF planting to natural flood management, assuming mature trees. Regions are ordered top-down by decreasing area of planting: some regions show greater uplift per hectare of planting (left), due to baseline capacity pre-planting and to additional storage from sites located in floodplains.
There are 3,606 NCF sites (46% of the planting) located in catchments identified by the Environment Agency as high priority for natural flood management (Figure 6.3)(Environment Agency 2021c). This is a higher proportion than would be expected if the sites were randomly located throughout the country (40%), so the NCF programme is in a good position to deliver flood regulation benefits where they are most needed and suitable.
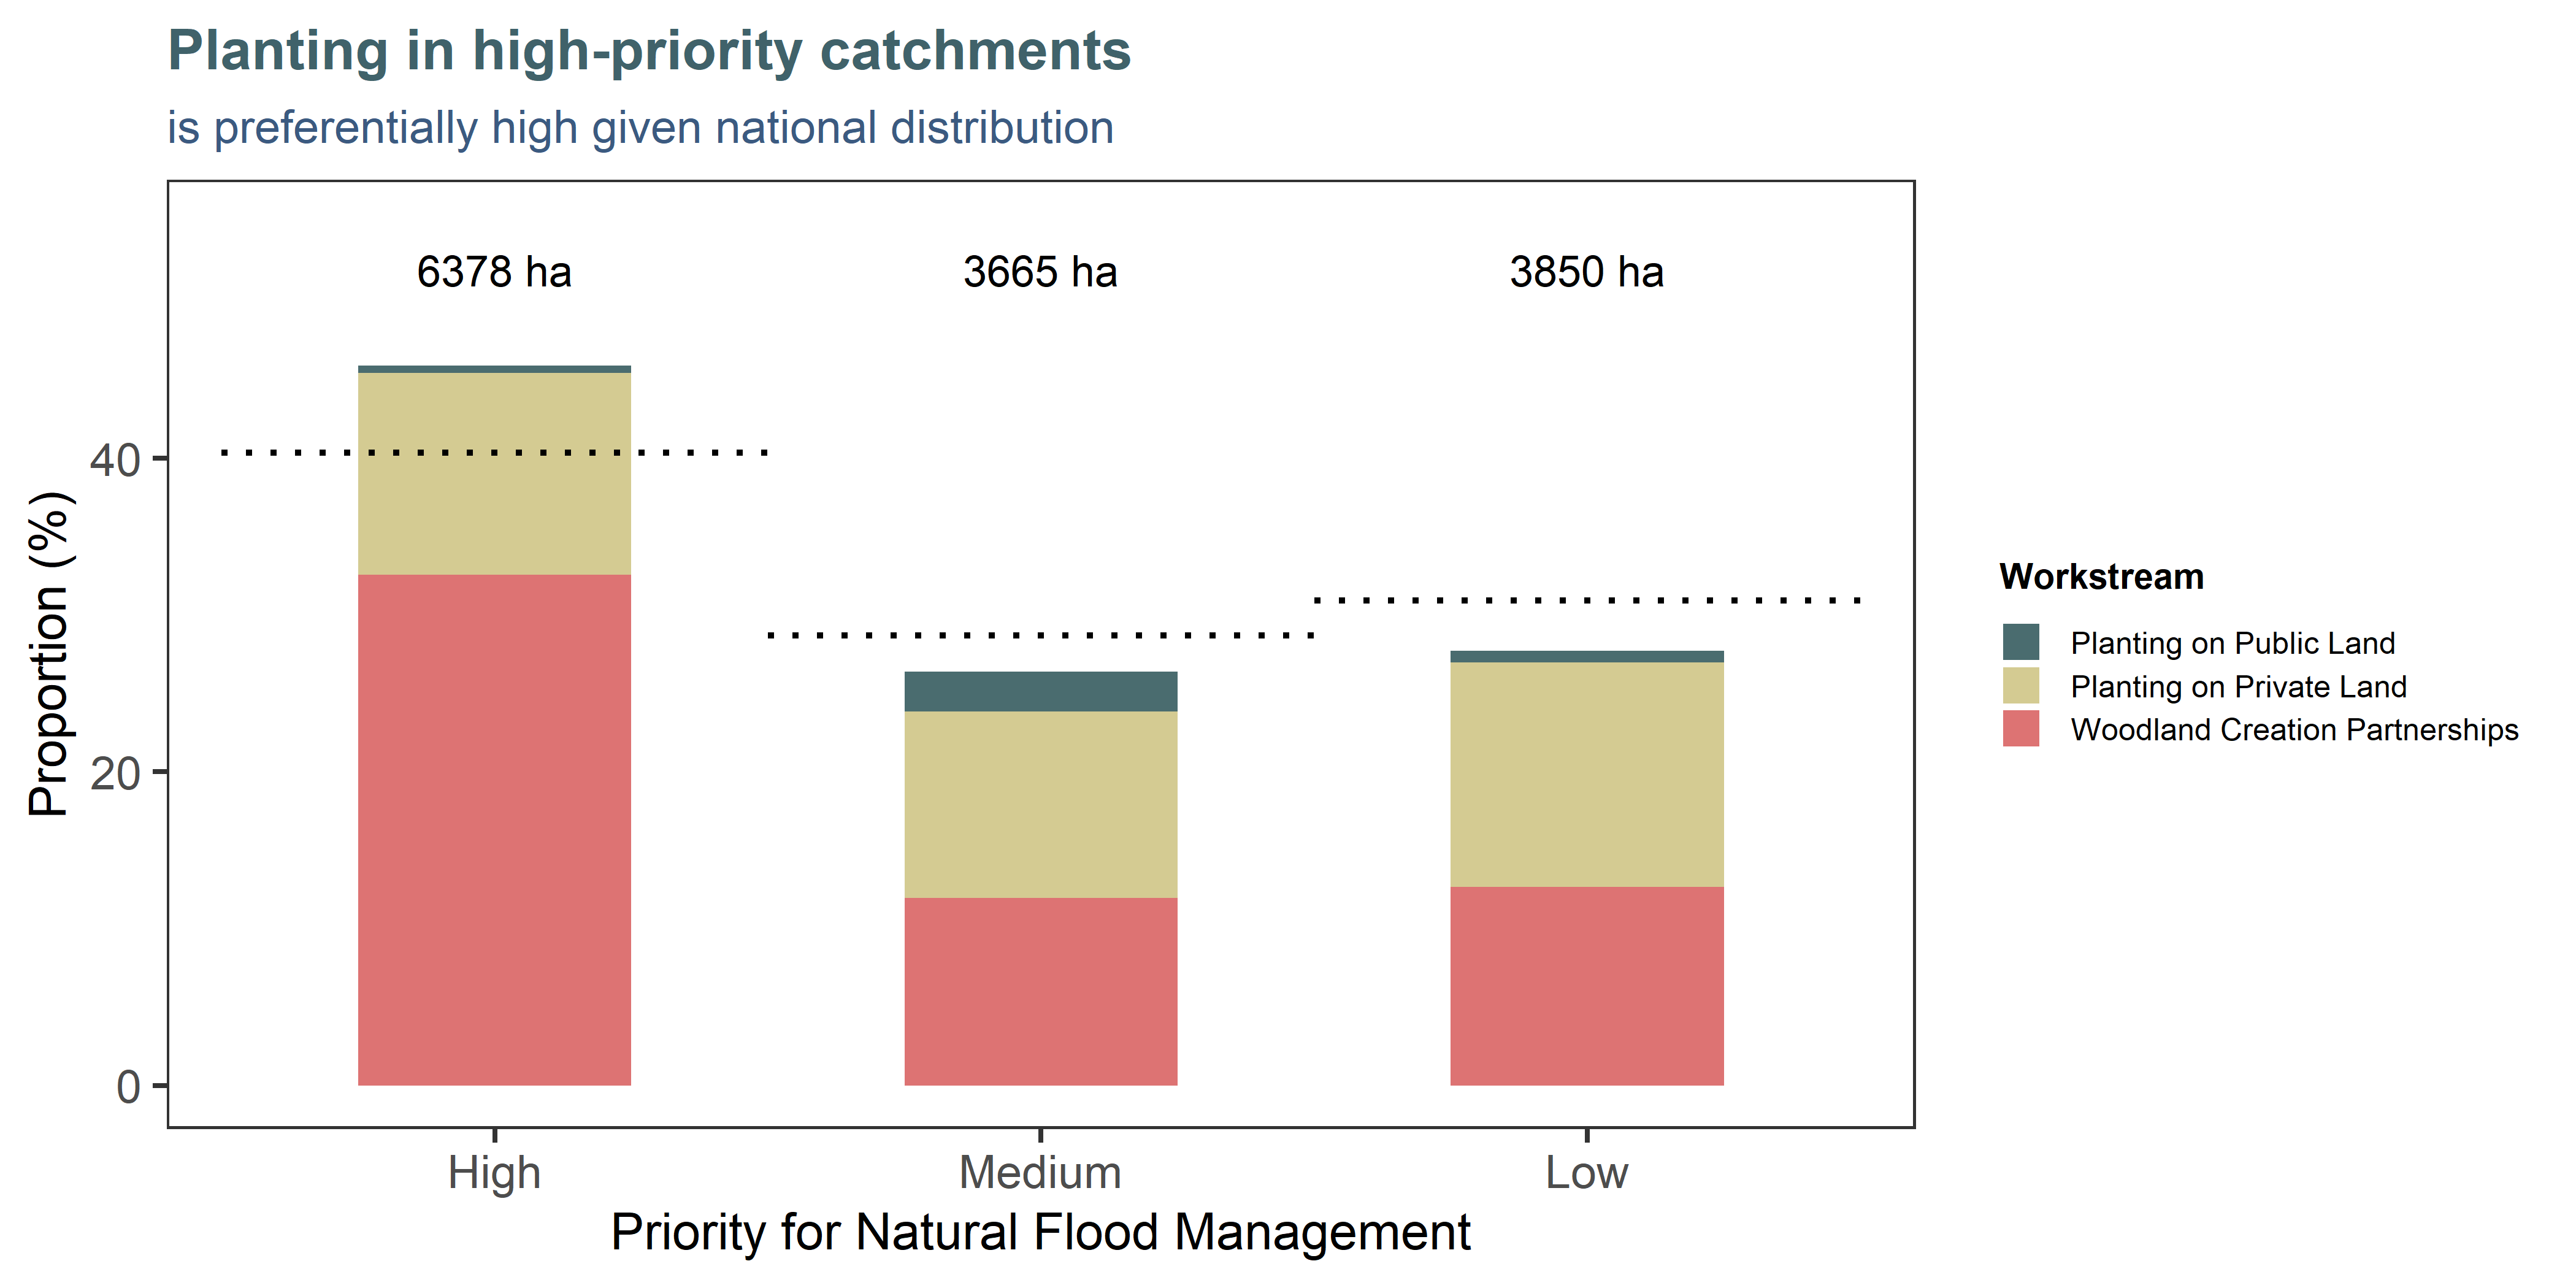
Figure 6.3: Nearly half of NCF planting is situated in catchments identified by the Environment Agency as being of high priority for natural flood management (NFM). Most of this is delivered through the Woodland Creation Partnerships. The bars indicate the proportions and total hectares planted in each category, while the dotted line indicate the expected proportions based on the proportions of the priority classes themselves in the national dataset. NB: Around r round(sum(reconciliation$calc_area_ha, na.rm=T) - sum(nfm_summary$area_ha), 0) ha fell in areas not covered by the NFM map (heavily built-up or transitional coastal water catchments) and are missing from this chart.
6.3 Approach and assumptions
We used the total published storage volume by mechanism (interception, belowground, hydraulic roughness) and habitat type (broadleaf vs coniferous woodland or trees outside woodland) for England (Broadmeadow et al. 2023), and divided the values by the associated reported hectares (woodland vs TOW), to derive per-hectare rates for all components (Table 6.2). We added rates for mixed woodland as an average of broadleaf and conifer values, and added a “parkland” value to represent large areas of sparse planting, which we assumed to be 10% of the capacity of trees outside woodland.
| Storage rate (m3) | ||
|---|---|---|---|
Habitat type | Interception | Water use | Physical barrier |
broadleaf | 24.91 | 274.88 | 521.67 |
conifer | 57.02 | 340.26 | 521.67 |
mixed | 40.96 | 307.57 | 521.67 |
TOW | 24.97 | 276.19 | 0.00 |
parkland | 2.50 | 27.62 | 0.00 |
Measuring the effectiveness of woodland in mitigating flood flows at a fine scale is very difficult and would require consideration of local terrain, hydrology, and catchment characteristics (Environment Agency 2023b). The modelling used by Forest Research (Broadmeadow et al. 2023) was originally run at resolution of 1km, but the results in the publication are presented as averages for the four UK countries. We could not access the raw data for this project, but a future improvement of the indicator could use the gridded or catchment-level outputs mentioned in the study to generate storage rates more representative of regional conditions. This indicator is still sensitive to the prior land use (such as that uplift is lower if the site footprint already contained features able to slow water) and to whether or not the planting contributes additional storage from being in a floodplain.