Chapter 8 Access to Nature
8.1 Indicator definition
Spending time in nature, such as woodland, can reduce the risk and effects of poor health and boost people’s wellbeing, potentially delivering considerable savings to the healthcare system (Beute et al. 2020). A recent study found that the annual mental health benefits associated with visits to woodlands in England was estimated at £155 million in 2020 (Saraev et al. 2021). In addition to supporting mental health, woodland visits can promote physical activity, foster social connections and community engagement and provide rich sensory experiences with nature (Butler 2025). To enable the population to reap these benefits, woodlands need to be publicly accessible and located within easy reach of people’s homes.
NCF planting has the potential to increase access to nature, contributing to the benefits outlined above. We developed two indicators to measure these gains. The distance indicator estimates how many households have had their access to nature (15-min walk threshold) increased or enhanced by NCF planting. The recreation indicator predicts the number of annual visits for NCF sites.
8.1.1 Distance indicator
This indicator is based on data and methodology from Defra’s official statistic Access to Green and Blue Space in England (Defra 2026a), which evaluates, at household level, the accessibility of natural spaces within walking distance. The size and proximity criteria are set to align with the Green Infrastructure Framework (Natural England 2024a) and the government’s “15-minute commitment” (Defra 2025), both designed to emphasise the importance of having good-quality sites close to home for health, wellbeing and contact with nature. The standards are:
- Doorstep: Green space of at least 0.5 ha within a 3-minute walk (ca. 200 m)
- Local: Green space of at least 2 ha within a 4.5-minute walk (ca. 300 m)
- Neighbourhood: Green space of at least 10 ha, or linear route along green or blue space of at least 550 m, within a 15-minute walk (ca. 4 km)
- 15-min commitment: a household is covered by the commitment when it meets at least one of the standards above
Around 80% of households in England already fall under the 15-min commitment (Defra 2026a). However, the provision of woodland sites is much lower: less than 40% of households have access to woodland over 2 ha within 1 km, and only 14% within 500 m (Beesley 2025). We ran two versions of the analysis, evaluating both general access (all green and blue spaces) and access to woodland only, using the same size and distance thresholds as the official statistics, to quantify the uplift in access to nature arising from NCF. We also explored access in relation to deprivation levels, and measured the total number of households with access to NCF sites (catchment population within a 15-min walk).
8.1.2 Recreation indicator
This indicator uses the Outdoor Recreation Valuation Tool (ORVal) to estimate the number of annual visits (and welfare value; see Chapter 9 associated with NCF woodland planting. ORVal enables simulation of both modifications to existing green spaces (where tree planting occurs within current sites) and the creation of new green spaces (where planting establishes new sites accessible to the public). The model predicts the probability that an individual will visit a specific green space on a given day. This probability varies according to the individual’s socioeconomic characteristics, the attributes and proximity of the site, and the availability and characteristics of alternative recreational green spaces.
8.2 Access standards results
NCF access profile
Around 42% of NCF woodland planting (4,418 ha) offered public access (considering only sites of at least 0.1 ha). Some sites can open up new areas for people to access, but ca. 46% of all accessible planting occurred on existing green infrastructure (e.g. city parks, country parks, etc).
At least 380 ha of trees outside woodland (TOW) planting were identified as accessible by delivery partners. Trees outside woodland were partly included in the distance analysis (where at least one component of a site was over 0.1 ha) but excluded from the recreation analysis. As most TOW schemes are very small-scale (e.g. individual or lines of street trees), they do not lend themselves to evaluation under the approaches described here.
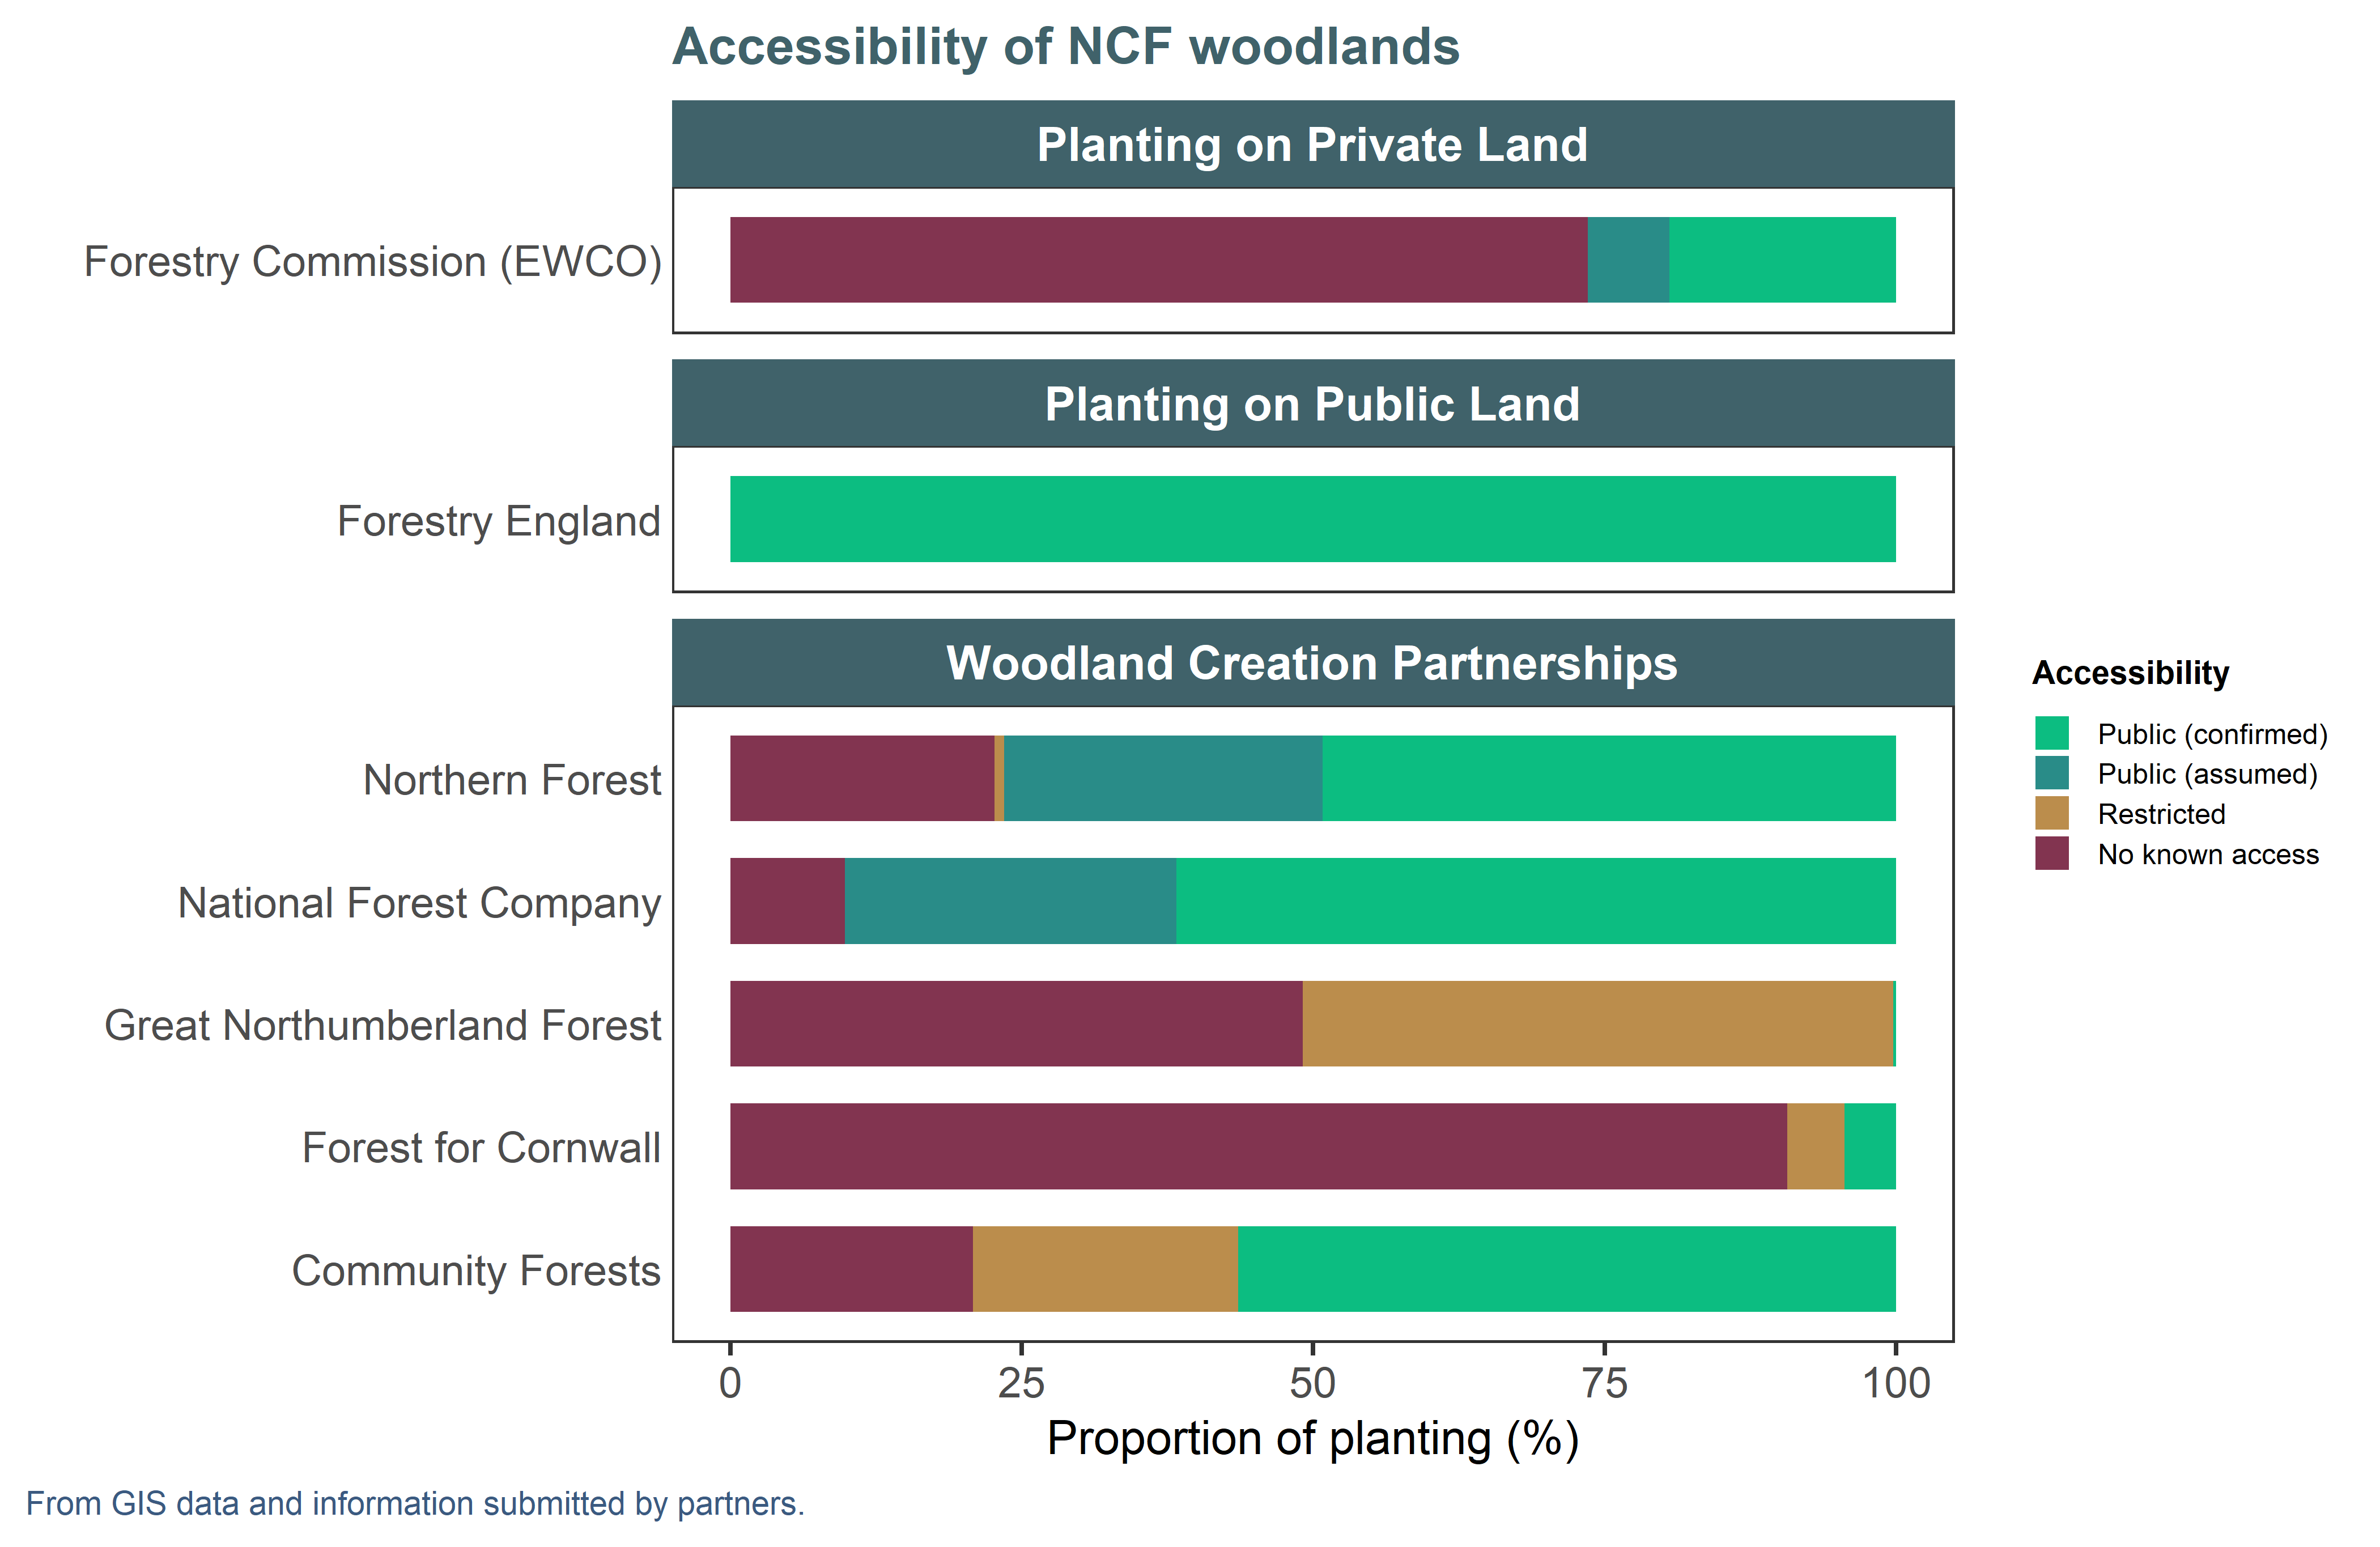
Figure 8.1: Accessibility profile of NCF woodland planting > 0.1 ha by partner and workstream. (Schemes like LATF and UTCF have no planting meeting these criteria and are omitted.) When accessibility was not provided by the partner, we inferred access based on overlaps with a green space layer. ‘No known access’ therefore groups private sites and sites of unknown status that are not on existing public green spaces. ‘Restricted’ means sites that may have partial access to groups of users (e.g. school grounds) but are not considered accessible for the analyses in this chapter.
Distance indicator
With existing green and blue infrastructure already providing much of the population with accessible sites (Defra 2026a) under a 15-minute walk, we found there was limited scope for NCF sites to increase this figure (Table 8.1): only around 2,000 households now meet the 15-minute commitment where they previously did not. NCF sites only contribute to this uplift when they create “new” green spaces (rather than planting in already accessible sites) and have to conform to the minimum size requirements, which left only 253 eligible sites (ca. 23% of sites with access). NB: Our analysis overestimated baseline access compared to the results published as official statistics, rendering gains from NCF even less likely: please see methods for a description of methodological differences.
While most houses in England have some form of green or blue space nearby, far fewer have similar access to woods. We estimate that NCF planting provided access to woodland for ca. 102,200 households who previously did not have a wooded site nearby (Table 8.1). For this analysis, a gain in access could arise from a site either creating new access (as above), or “enhancing” an existing green space by adding woodland (which we defined as the intervention being at least 0.1 ha in size and representing at least 20% of its host green space’s area). Just over 1,100 sites contributed gains in access for this metric.
| Any type | Woods only | ||||
|---|---|---|---|---|---|---|
Standard | Minimum size | within | Pass (%) | Gains (n) | Pass (%) | Gains (n) |
Doorstep | 0.5 ha | 3 min | 27 | 8,800 | 6 | 65,700 |
Local | 2 ha | 4.5 min | 28 | 3,700 | 7 | 53,300 |
Neighbourhood | 10 ha | 15 min | 81 | 100 | 15 | 45,000 |
15-min commitment | 87 | 2,000 | 19 | 102,200 | ||
The nuance between gains in access to woodland, versus access to green space generally, is very apparent at regional level. In most regions and under most standards, NCF sites cater to fewer than 500 households that did not previously have access to a green or blue space (Figure 8.2). Gains are minimal for the neighbourhood standard, because the majority of the population already has access to large (10 ha) sites within a 15-minute walk. The majority of NCF sites are smaller than 10 ha, so planting only tends to improve access under the doorstep and local standards, when very close to dense populations. In the North West and in Yorkshire and the Humber, over 2,000 households benefit from improved access due to NCF under the shorter-distance standards (3-4.5 minute walk), probably reflecting the high density of urban planting in places like Manchester and Leeds.
In contrast, while London and the Midlands have a relatively high baseline of access to green spaces, very few households have access to woodland specifically (Figure 8.3). Accessible NCF planting is especially effective at providing houses with woodland access in London under the shorter standards. Land availability may be a constraint to providing larger woodlands to the population there.
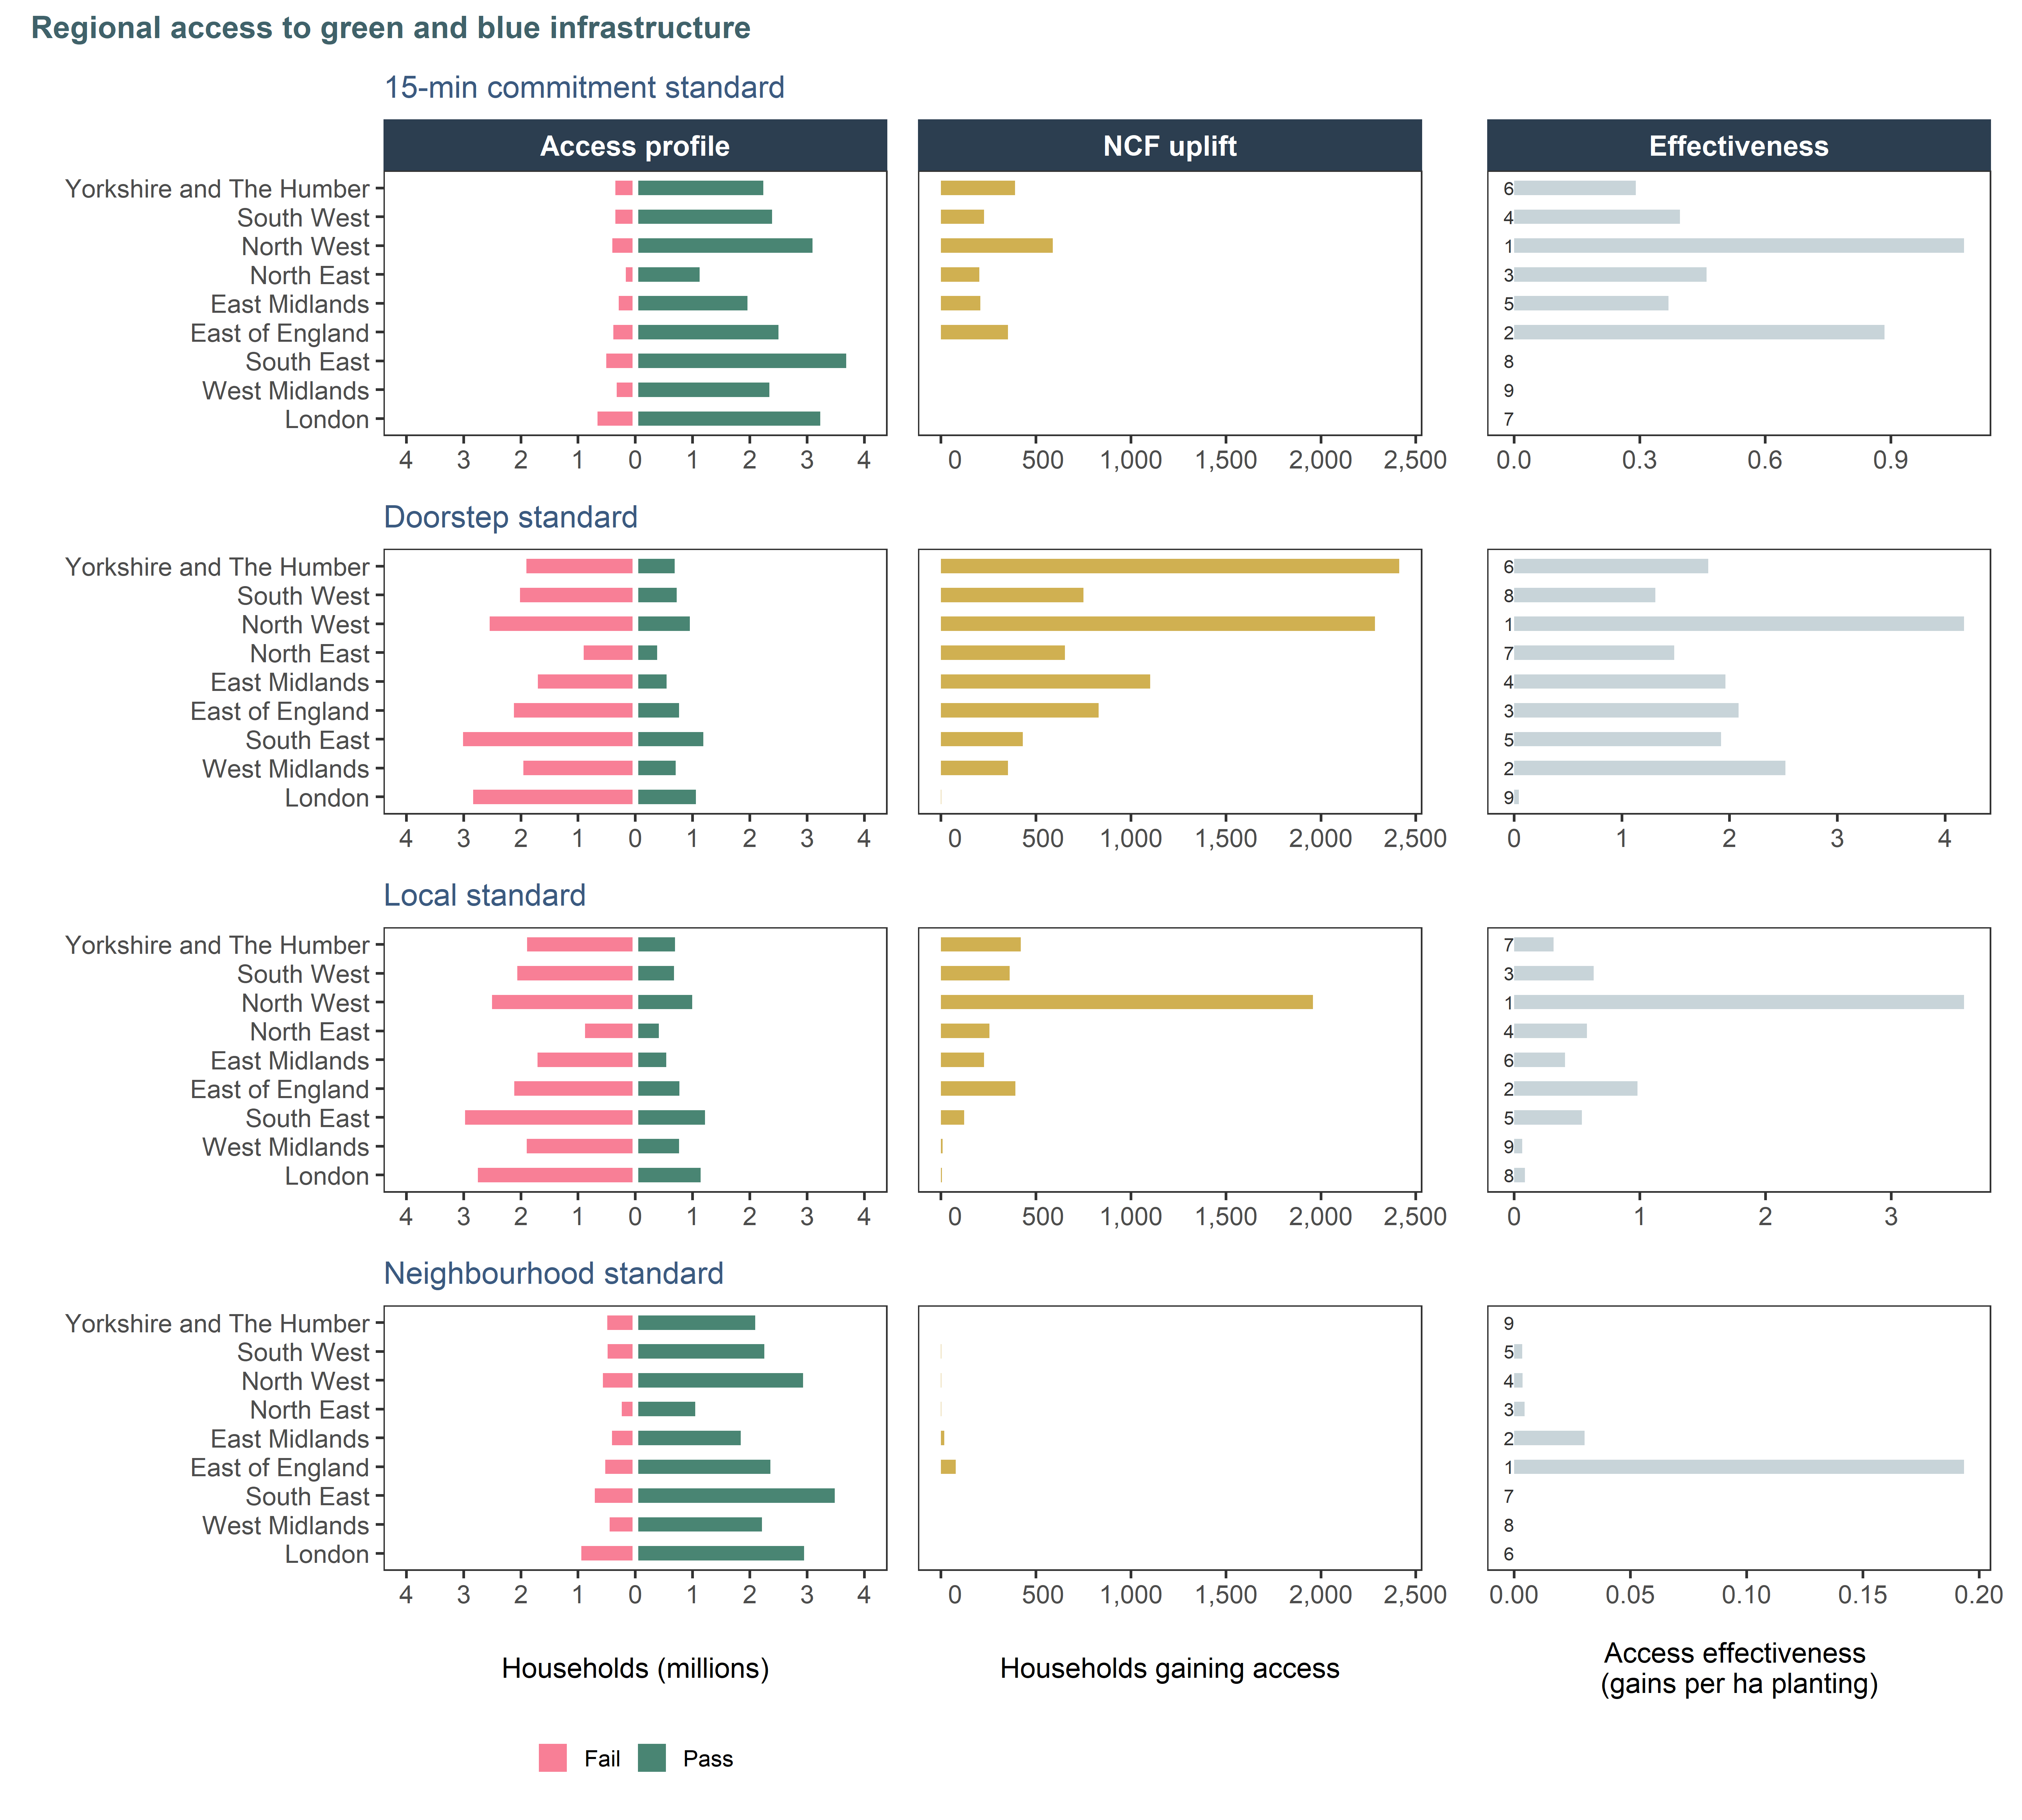
Figure 8.2: Regional variation in access to green and blue space in England, as defined by Defra’s official statistics. The profile column shows how many households pass or fail the standard in the region. The central column shows gains in access (conversions from Fail to Pass) due to NCF: notice the change in magnitude on the x axis. The effectiveness column is a standardised measure of how many households gain access for a hectare of accessible woodland planted. Regions are ordered top-down by decreasing area of planting. Effectiveness ranking is annotated, 1 being the best.
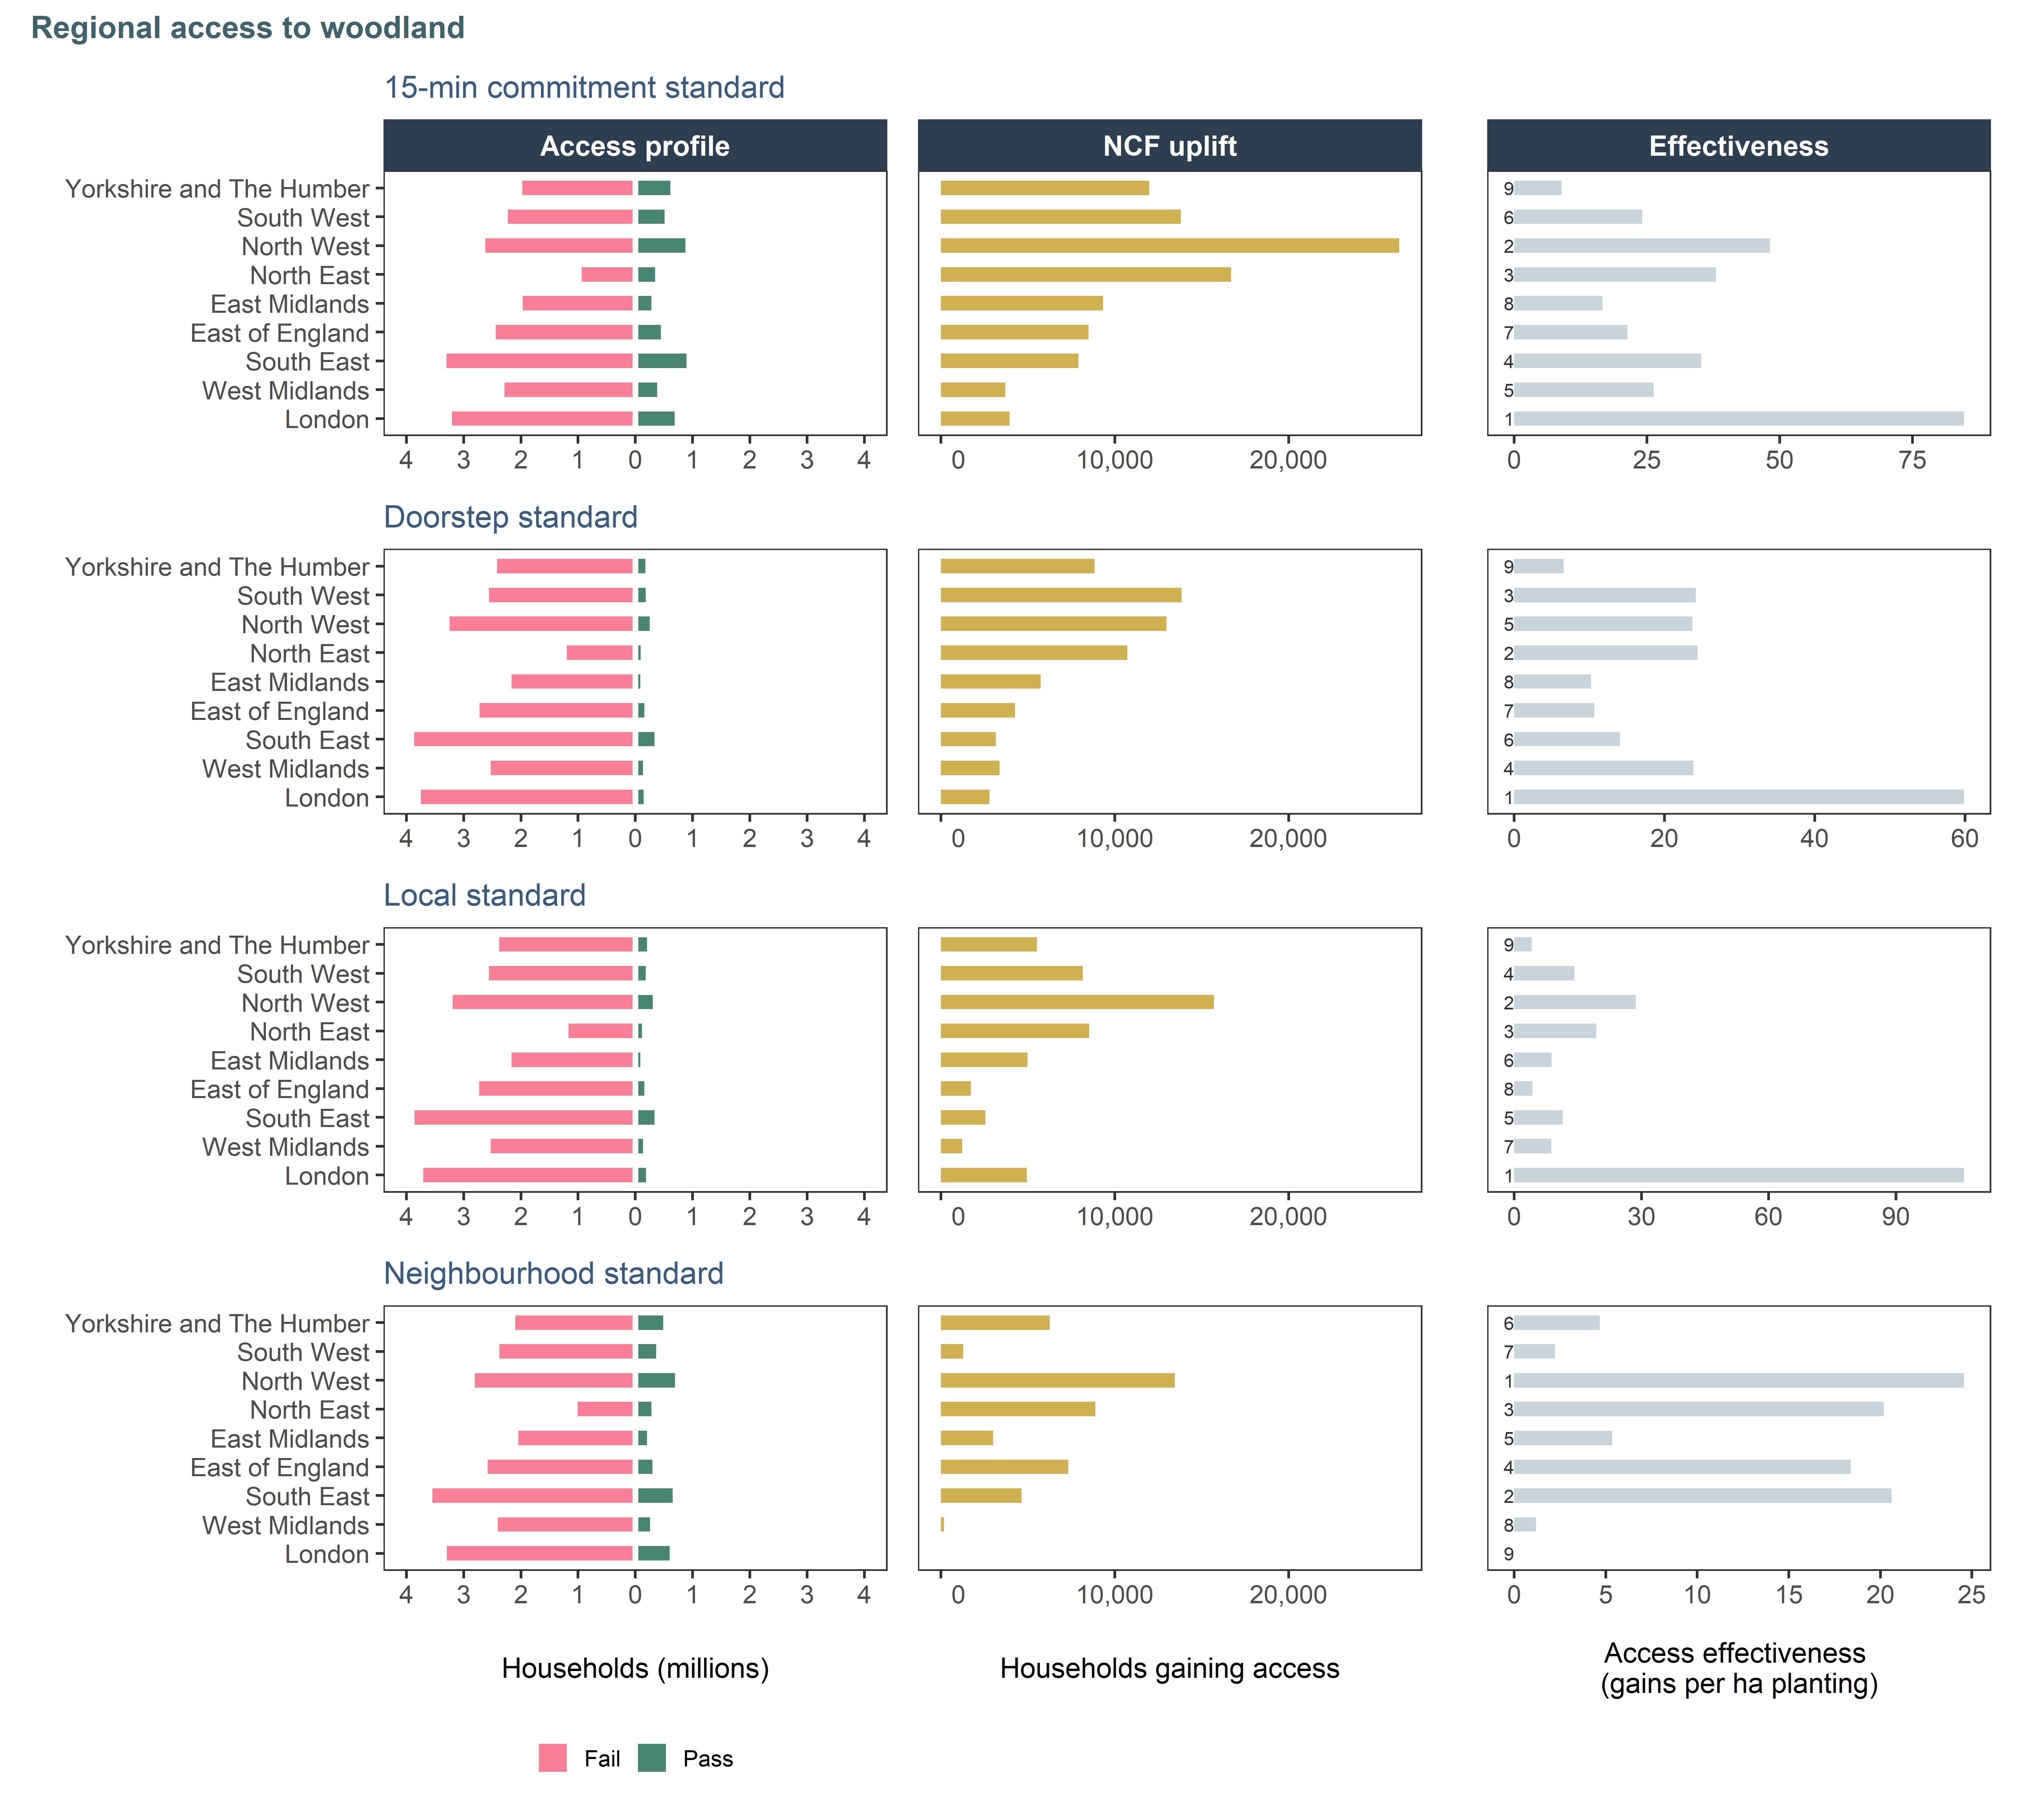
Figure 8.3: Regional variation in access to woodland in England (sites originating from Woods for All dataset). The profile column shows how many households pass or fail the standard in the region. The central column shows gains in access (conversions from Fail to Pass) due to NCF: notice the change in magnitude on the x axis. The effectiveness column is a standardised measure of how many households gain access for a hectare of accessible woodland planted. Regions are ordered top-down by decreasing area of planting. Effectiveness ranking is annotated, 1 being the best.
Access and deprivation
Only around 3% of all NCF planting falls within the top 10% most deprived areas in England, but accessible sites in these areas account for 17% of households gaining access to woodland (any standard). It is likely that houses in strongly deprived areas have fewer green spaces and woods close to them, hence the disproportionate NCF benefit in this demographic (Figure 8.4).
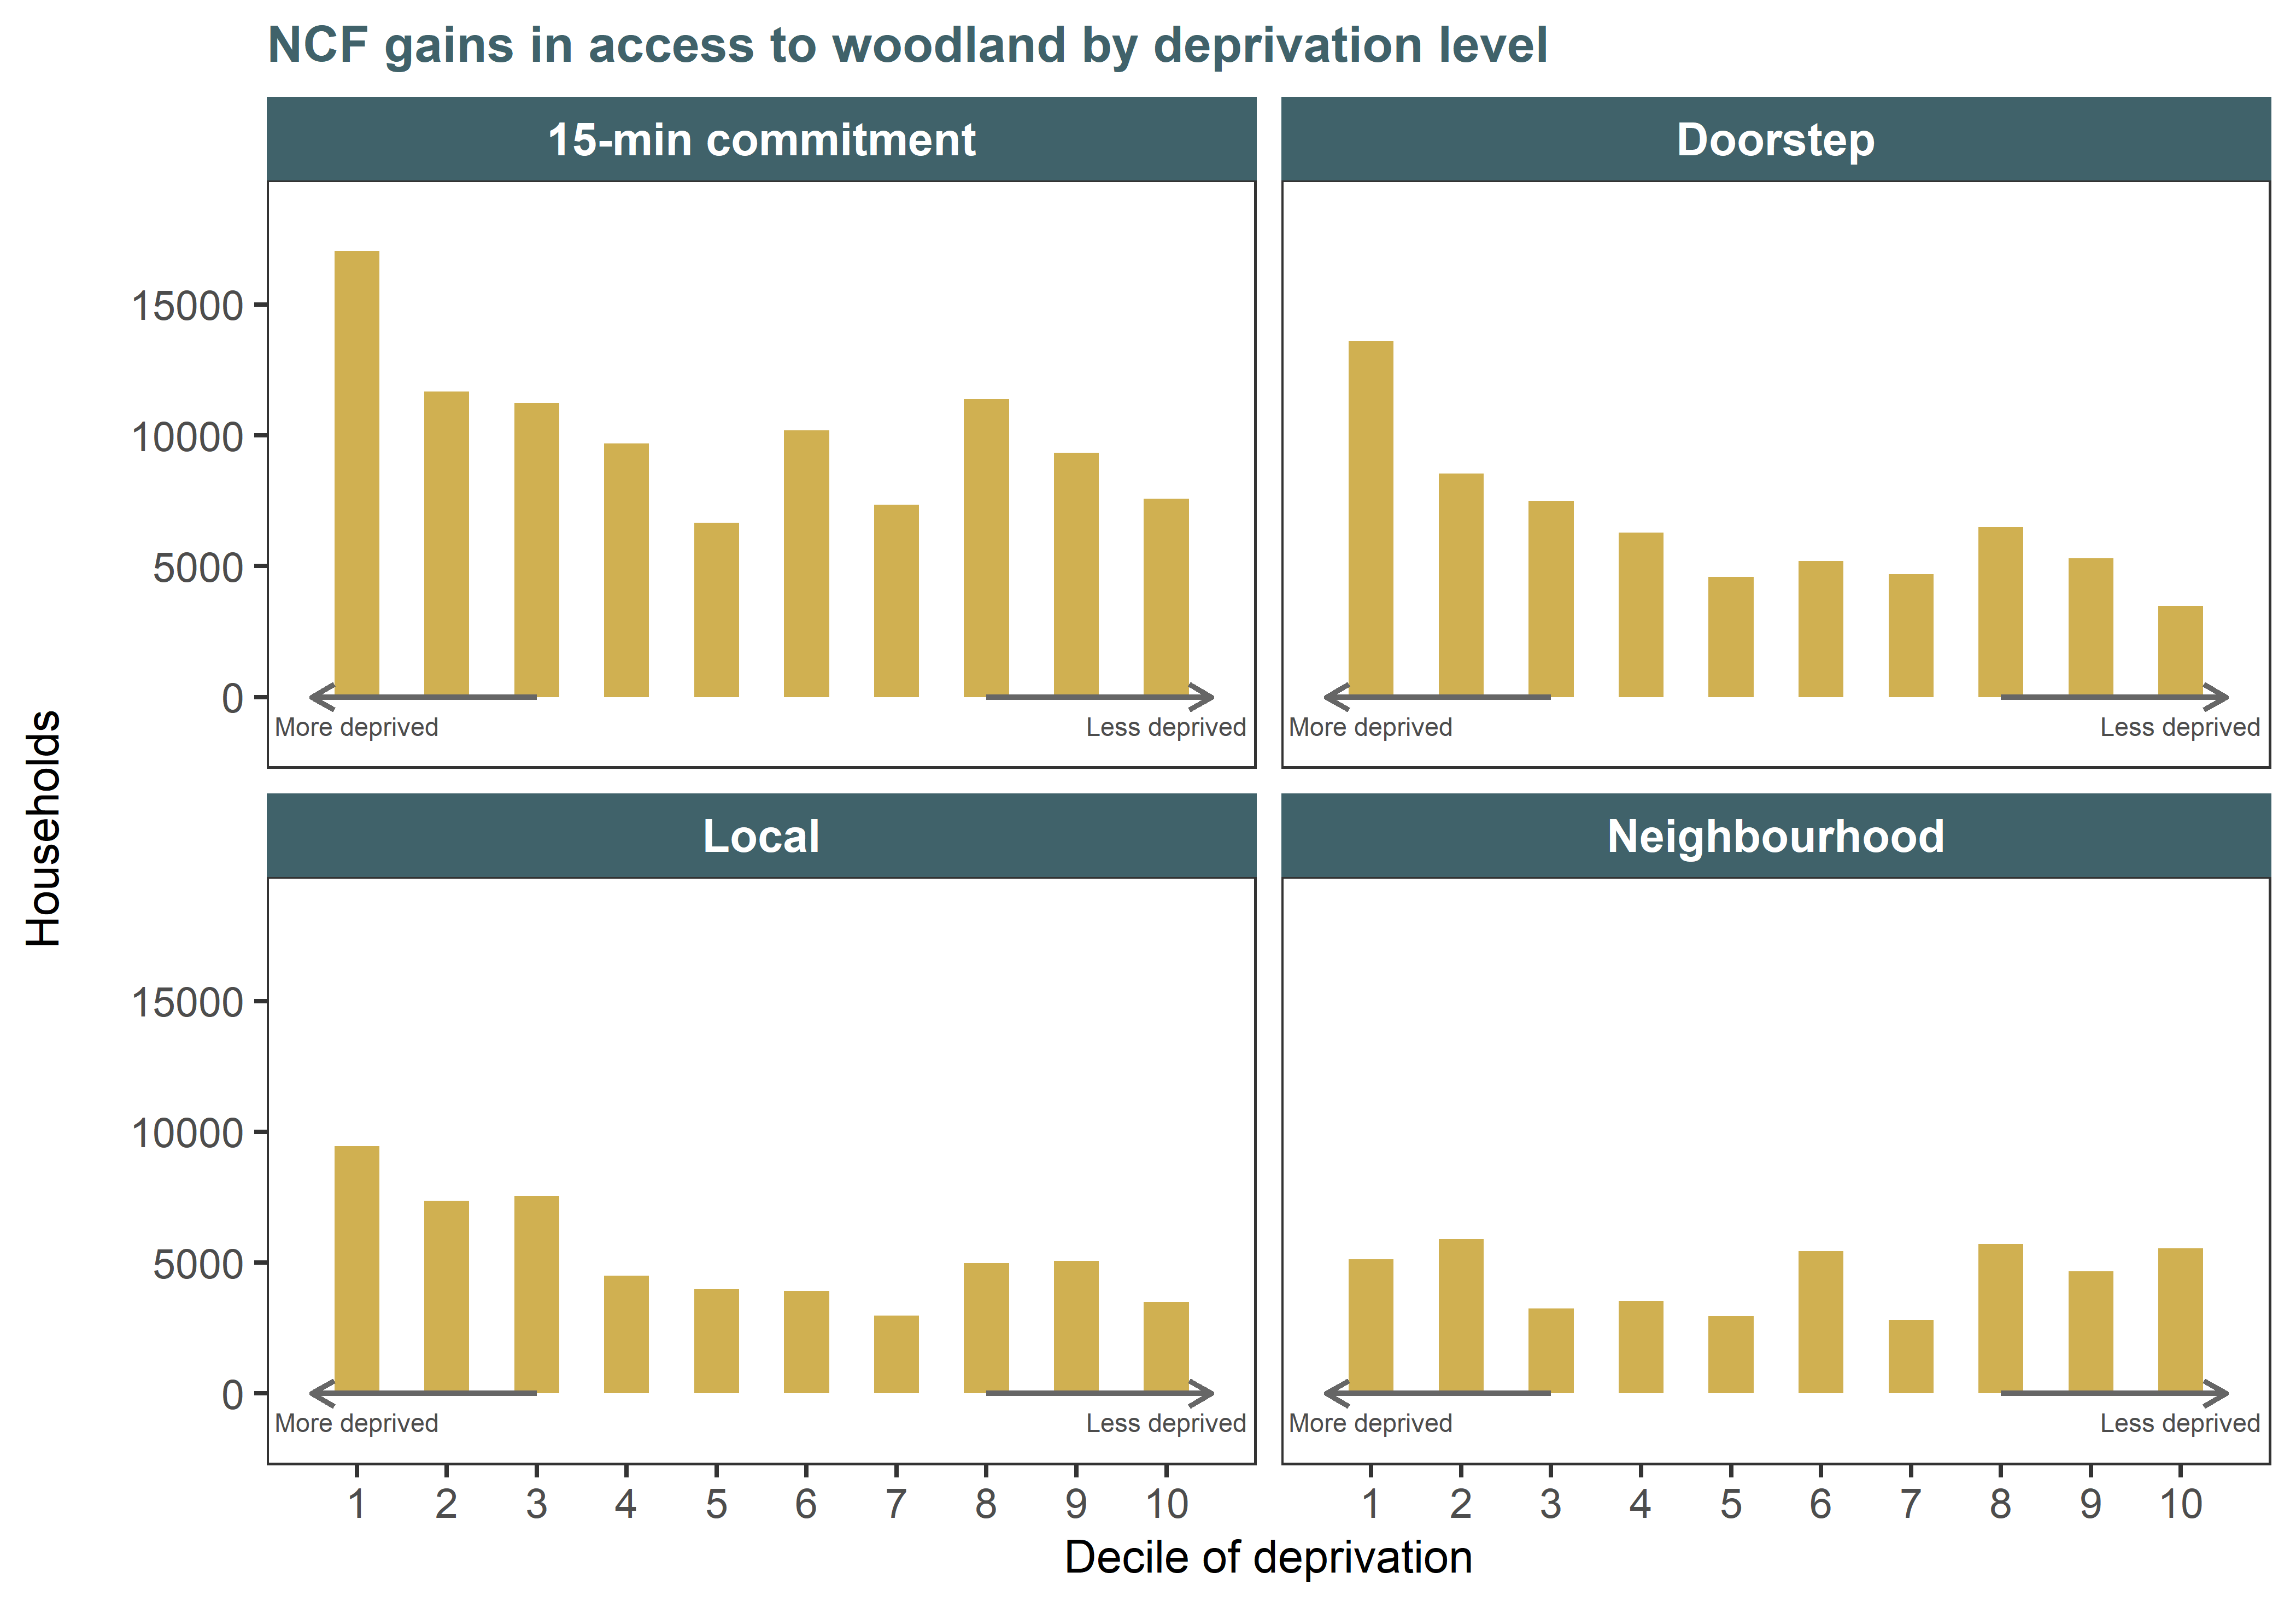
Figure 8.4: NCF access gains by decile of deprivation, considering access to wooded sites only.
NCF catchment population
While NCF planting only modestly improves access for households not otherwise served by any green space, it does provide new alternatives or enhanced spaces to visit within a short distance of people’s homes (regardless of how many other sites they can access). Over a million households in England have access to at least one NCF site within a 15-minute walk (Table 8.2).
| Households served by NCF sites | ||
|---|---|---|---|
Region | creating access | on green spaces | combination |
Yorkshire and The Humber | 4,500 | 201,500 | 205,200 |
South West | 1,300 | 177,600 | 178,600 |
North West | 4,200 | 382,800 | 386,200 |
North East | 1,500 | 196,700 | 197,800 |
East Midlands | 2,100 | 90,200 | 92,300 |
East of England | 1,900 | 81,100 | 82,900 |
South East | 600 | 64,000 | 64,600 |
West Midlands | 600 | 53,800 | 54,200 |
London | 0 | 140,700 | 140,700 |
Total | 16,700 | 1,388,400 | 1,402,500 |
8.3 Recreation results
Once mature, NCF sites with public access could generate up to 16.6m visits annually. This is slightly more than the 15.3m annual visits to the British Museum, Natural History Museum and the Tower of London combined (VisitEngland 2025). Around 15% of visits are predicted to be to NCF planting locations associated with existing green spaces, while the remaining 85% are to locations where no accessible green space was known prior to woodland planting.
We ran a second version of the analysis (sensitivity analysis), applying a 0.5ha threshold (instead of 0.1ha) as minimum size for new green spaces. This decreased the estimated total to 12.0 million visits annually. Under this threshold, 21% of visits were generated by sites associated with existing green spaces, compared with 79% from sites not previously associated with green spaces.
8.4 Approach and assumptions
Distance indicator
Alignment with official access statistics
For the walking distance analysis, Defra kindly shared with us all data used for the official statistics in development, so that our indicator was grounded into the same access baseline and used the same standards. Data shared included:
- household locations (25.9M households in England) (Ordnance Survey 2026)
- routing data (nodes and edges) representing the walking network (Ordnance Survey 2024)
- green and blue spaces (to evaluate size criteria), compiled from a range of spatial datasets
- access points into nature spaces, representing where people enter the sites from the road
The analysis uses a shortest path analysis that measures, for every household, the quickest walking time to every green or bluespace in the vicinity. The network includes corrections for elevation (walking uphill is slower) and promotes safer routes (stretches with less than 75% pavement are penalised to de-incentivise the model to choose them). We refer the reader to the official technical report (Defra 2026b) for more details.
We were able to replicate Defra’s analysis, except for the doorstep distance correction (accounting for the distance between the door of a building to the modelled starting point of the route, which is always a “node”, i.e. a street corner or junction). The correction is complex as it requires calculating the direction of travel for every household x greenspace pair, and we were unable to implement it with the computing power available at the time. We believe that this caused the overestimation in our baseline access figures compared to the official statistics, as the discrepancies are greater for the shorter standards. In simple terms, failing to correct for a +/- 1 minute doorstep-to-node walking time can easily make the difference between a pass and a fail when evaluating whether a greenspace is less than 3 minutes away, but less likely to affect the neighbourhood standard of 15 minutes. We are looking to implement the correction in the next version of the analysis for full alignment with the official statistics.
Uplift from NCF sites
We filtered the planting masterfile to retain sites with unknown and confirmed access. Where unknown, we intersected the sites with the Defra baseline of accessible spaces: if there was overlap, we encoded them as “assumed access” as this indicates that the planting occurred on an existing green space such as a city park. Where they did not overlap, we rejected the sites as not having access.
This overlap test also allowed us to encode NCF sites as either “sites with prior access” or “sites creating new access”. For the former case, we used Defra’s pre-processed access points for the green space “host”, duplicating them but assigning them the NCF site identifier to track them in the post-planting analysis. In real-life terms, this means that to access NCF planting in an existing park, a user only has to get to the park, not to the specific location of the planting within the park. For sites creating new access (no previous greenspace at the location), we had to generate access points, following Defra’s method (Defra 2026b). This involved creating a 10-m buffer ring around the site and intersecting it with a database of paths and roads (network edges and rights of way). Places where a path intersects the buffer were defined as access points. When no point was generated through this method, we created a point along the perimeter of the site, at the location closest to a network node. All the NCF access points, with their updated ID matching NCF sites, were recombined into the main access point layer for the analysis.
We ran the shortest path analysis for all of England. Once travel times were established for every household x site pair, we assigned each household a status under the three official standards, their wood-only version, and the overall 15-minute commitment (Table 8.1):
- Pass: meets the standard from an existing green or blue infrastructure
- Fail: does not meet the standard and is not improved by NCF
- NCF Gain: standard was not met previously, but is now met due to presence of an NCF site
For the “woods-only” version of the analysis, we defined the baseline of accessible sites as all the green spaces and access points in Defra’s shared data that originated from the Woods for All (Forestry Commission 2025) layer. Other sites, classified more generally as “green space”, did not count towards the baseline, but could become “wooded” by NCF, and therefore count as a wood in the post-planting results, when interventions covered at least 20% of the green space.
Recreation indicator
The Outdoor Recreation Valuation Tool (ORVal) v2.0 was used to estimate recreational visits to accessible NCF sites and their associated welfare values (see Chapter 9. Site components planted on or near (≤10 m) existing green spaces were assessed using ORVal’s Alter Sites function, which updates land cover proportions to reflect the planting and recalculates the recreational value. Components not represented in ORVal’s green space database were evaluated using the “Create Sites” function, which allows specification of a new green space’s location, size and land cover.
To prepare the NCF layer for ORVal, sites were first filtered to woodland and parkland interventions. When a site was formed of multiple parts, we clumped together parts within 20m of each other. We retained site components of over 0.1 ha in size (a sensitivity test using a 0.5ha threshold for new sites was also conducted). As some 2024–25 NCF sites had ‘Unknown’ access status, the ORVal Parks layer was used to classify site components as ‘Public’ if they overlapped or were within 10m of an ORVal Park feature.
For each ORVal green space associated with an NCF site, baseline land cover data were retrieved via the ORVal web platform and filtered to four modifiable classes: “agriculture”, “managed grass”, “natural grass”, and “moors & heath”. Green spaces were then updated to reflect the planting, with land cover adjusted according to the amount of planting within park areas. Once the land cover proportions were recalculated, the ORVal platform was queried again to estimate the resulting changes in visitation for each green space. NCF sites that were >10m from an ORVal green space were assessed by creating new green spaces via the ORVal web platform (Create Sites functionality).
Recreational benefits from NCF planting were assessed based on publicly accessible woodland and parkland sites, but not all interventions could be valued. Some interventions were not valued fully due to insufficient modifiable land cover within the corresponding ORVal green spaces. For a small number of sites (n = 31), reliable estimates could not be obtained due to intermittent issues with the ORVal platform or because quality assurance checks flagged the outputs as anomalous.
The analysis focused on larger sites (≥0.1 ha) and did not include trees outside woodland, such as hedgerows and lines of trees, which may still enhance green space attractiveness and contribute to recreational value, particularly in urban areas (Binner et al. 2017). As a result, the estimates of visitor numbers and welfare values presented in this report are likely conservative.